R によるデータ可視化
いままで pandas + matplotlib による多彩なデータプロッティング や matplotlib (+ pandas) によるデータ可視化の方法 において matplotlib を利用したデータの可視化を紹介しました。
R によるデータ可視化はさらに簡単で強力です。基本的なプロッティングについては前回と同様に奥村先生のページがとても参考になります。
グラフの描き方
http://oku.edu.mie-u.ac.jp/~okumura/stat/graphs.html
この中から matplotlib でも取り扱った最も基本的なグラフとも言うべき棒グラフ、折れ線グラフ、散布図について R でのプロッティングをしてみます。
棒グラフ
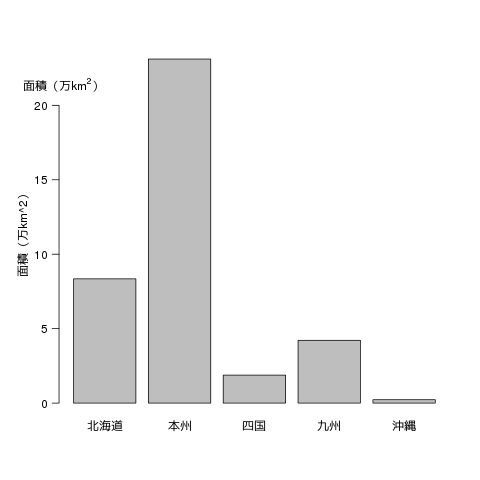
棒グラフは比例尺度の量をあらわすのに使われます。
png("image.png", width = 480, height = 480, pointsize = 12, bg = "white", res = NA)

region = c("北海道","本州","四国","九州","沖縄")
area = c(83457,231113,18792,42191,2276) / 10000

par(las=1)              # 縦軸の文字を横向きにしない(las: label style)
par(mgp=c(2,0.8,0))     # 軸マージン(デフォルト: c(3,1,0))

barplot(area, names.arg=region, ylab="面積(万km^2)")
axis(2, labels=expression(paste("面積(万", km^2, ")")),
     at=20, hadj=0.3, padj=-1, tick=FALSE)
基本的に barplot することによってプロッティングできます。
png とすることで画像ファイルを生成することができます。特にデスクトップ環境をインストールしていない計算機で処理する場合はこういった方法を利用します。
参考
グラフの例:地域別面積
http://oku.edu.mie-u.ac.jp/~okumura/stat/100410a.html
折れ線グラフ
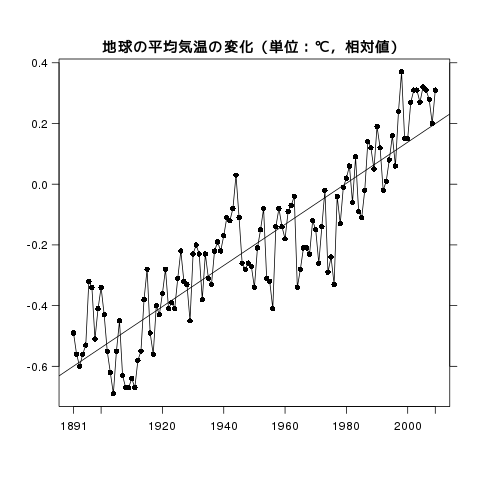
折れ線グラフは両軸とも間隔尺度以上であるのが基本です。始点が 0 でなくても構いません。
par(las=1)              # 縦軸の文字を横向きにしない
par(mgp=c(2,0.8,0))     # 軸マージン(デフォルト: c(3,1,0))

気温 = c(-0.49, -0.56, -0.6, -0.56, -0.53, -0.32, -0.34, -0.51,
-0.41, -0.34, -0.43, -0.55, -0.62, -0.69, -0.55, -0.45, -0.63, -0.67,
-0.67, -0.64, -0.67, -0.58, -0.55, -0.38, -0.28, -0.49, -0.56, -0.4,
-0.43, -0.36, -0.28, -0.41, -0.39, -0.41, -0.31, -0.22, -0.32, -0.33,
-0.45, -0.23, -0.2, -0.23, -0.38, -0.23, -0.31, -0.33, -0.22, -0.19,
-0.22, -0.17, -0.11, -0.12, -0.08, 0.03, -0.11, -0.26, -0.28, -0.26,
-0.27, -0.34, -0.21, -0.15, -0.08, -0.31, -0.32, -0.41, -0.14, -0.08,
-0.14, -0.18, -0.09, -0.07, -0.04, -0.34, -0.28, -0.21, -0.21, -0.23,
-0.12, -0.15, -0.26, -0.14, -0.02, -0.29, -0.24, -0.33, -0.04, -0.13,
-0.01, 0.02, 0.06, -0.06, 0.09, -0.09, -0.11, -0.02, 0.14, 0.12, 0.05,
0.19, 0.12, -0.02, 0.01, 0.08, 0.16, 0.06, 0.24, 0.37, 0.15, 0.15,
0.27, 0.31, 0.31, 0.27, 0.32, 0.31, 0.28, 0.2, 0.31)
年 = 1891:2009

plot(年, 気温, type="o", pch=16, xlab="", ylab="", xaxt="n")
t = c(1891, seq(1900,2000,20), 2009)
axis(1, t, t)
axis(4, labels=FALSE)
title("地球の平均気温の変化(単位:℃,相対値)", line=0.5)

# 線形回帰
res = lm(気温 ~ 年)
summary(res)
abline(res)
基本的に plot(x, y) とすればプロッティングができます。上の例では線形回帰もおこなっています。
参考
グラフの例:地球温暖化
http://oku.edu.mie-u.ac.jp/~okumura/stat/090503c.html
散布図
png("image.png", width = 480, height = 480, pointsize = 12, bg = "white", res = NA)

kenmei = c("北海道", "青森県", "岩手県", "宮城県", "秋田県", "山形県", "福島県", "茨城県", "栃木県", "群馬県", "埼玉県", "千葉県", "東京都", "神奈川県", "新潟県", "富山県", "石川県", "福井県", "山梨県", "長野県", "岐阜県", "静岡県", "愛知県", "三重県", "滋賀県", "京都府", "大阪府", "兵庫県", "奈良県", "和歌山県", "鳥 取県", "島根県", "岡山県", "広島県", "山口県", "徳島県", "香川県", "愛媛県", "高知県", "福岡県", "佐賀県", "長崎県", "熊本県", "大分県", "宮崎県", "鹿児島県", "沖縄県")
population = c(5535, 1392, 1352, 2340, 1108, 1188, 2052, 2964, 2011, 2012, 7113, 6122, 12838, 8917, 2391, 1101, 1168, 812, 871, 2171, 2100, 3800, 7403, 1875, 1402, 2629, 8806, 5586, 1404, 1012, 595, 725, 1948, 2869, 1463, 794, 1003, 1444, 773, 5054, 856, 1440, 1821, 1200, 1136, 1717, 1376)
area = c(83457, 8919, 15279, 6862, 11434, 6652, 13783, 6096, 6408, 6363, 3767, 5082, 2103, 2416, 10363, 2046, 4186, 4190, 4201, 13105, 9768, 7329, 5116, 5761, 3767, 4613, 1898, 8396, 3691, 4726, 3507, 6708, 7010, 8479, 6114, 4147, 1862, 5678, 7105, 4845, 2440, 4104, 7077, 5099, 6346, 9044, 2276)

par(las=1)          # 縦軸の文字を横向きにしない
par(mgp=c(2,0.7,0)) # マージンの調節(デフォルト: c(3,1,0))
x = population/1000
y = area/10000
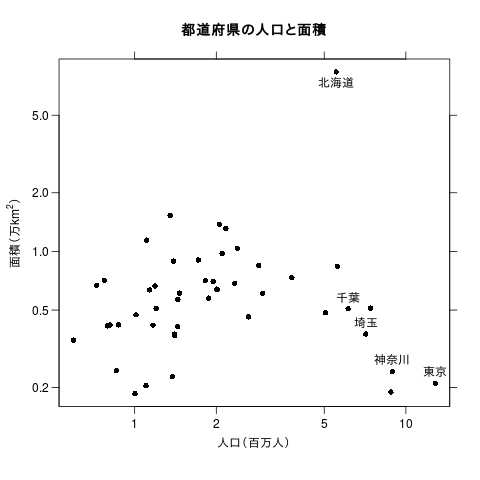
plot(x, y, xlab="人口(百万人)",
     ylab="", pch=16, log="xy")

axis(3, labels=FALSE)
axis(4, labels=FALSE)
pch=kenmei

text(population[kenmei=="東京都"]/1000,
     area[kenmei=="東京都"]/10000,
     "東京", pos=3)
text(population[kenmei=="北海道"]/1000,
     area[kenmei=="北海道"]/10000,
     "北海道", pos=1)
text(population[kenmei=="埼玉県"]/1000,
     area[kenmei=="埼玉県"]/10000,
     "埼玉", pos=3)
text(population[kenmei=="千葉県"]/1000,
     area[kenmei=="千葉県"]/10000,
     "千葉", pos=3)
text(population[kenmei=="神奈川県"]/1000,
     area[kenmei=="神奈川県"]/10000,
     "神奈川", pos=3)

title("都道府県の人口と面積")
title(ylab=expression(paste("面積(万", km^2, ")")), line=2.5)
散布図を描くのも簡単です。上の例では一部のデータ点に注釈を加えています。
参考
グラフの例:都道府県別人口・面積
http://oku.edu.mie-u.ac.jp/~okumura/stat/090509b.html
まとめ
奥村先生のページにはとにかく豊富な情報がありますので R に関してはまずここを参照すればまちがいないといえるでしょう。またそれ以外にもデータ可視化や統計に関する示唆に富んだ極めて有益な情報が豊富にありますのでデータの分析をする者は必ず一度は目を通しておくべきかと思います。


