科学技術計算用言語としての Python
そもそもなぜデータ分析などの科学技術計算を Python でやるのでしょうか。主に次の二点によります。
- NumPy, pandas, matplotlib など豊富なライブラリが揃っている
- 汎用性の高いグルー言語として利用できる
データフレームを利用した計算とそのグラフ描画 (プロッティング) のみであれば R のほうがどちらかといえば簡単かもしれません。しかし統計解析を汎用性の高い Python で完結させることで様々な分野へのより幅広い応用が可能になります。
NumPy
統計解析の多くはベクトル演算を伴います。 NumPy は高速でメモリ効率の良い多次元配列の実装である ndarray を備えています。プログラミング言語に元から備わっている配列・ハッシュオブジェクトでは到底かなわないような高次元のベクトル演算を可能にします。またファンシーインデックス参照 (= インデックス参照に整数配列を用いる) といったこともできます。
ベクトルのスカラー演算
科学技術計算は複雑ですのでベクトルの要素ごとにループを書いていたら大変なことになります。そこでベクトル演算はほぼ必須とも言えます。 NumPy では ndarray とスカラーの演算も次のように記述できます。
arr = np.array ( [[1., 2., 3.], [4., 5., 6.]] ) # ndarray オブジェクト

arr * arr # ベクトルの積算
# => array([[  1.,   4.,   9.],
#       [ 16.,  25.,  36.]])

arr - arr # ベクトルの減算
# => array([[ 0.,  0.,  0.],
#       [ 0.,  0.,  0.]])

1 / arr # スカラーと ndarray の算術演算
# => array([[ 1.        ,  0.5       ,  0.33333333],
#        [ 0.25      ,  0.2       ,  0.16666667]])

arr2d = np.array ([[1,2,3],[4,5,6],[7,8,9]])

arr2d[:2] # スライスによるインデックス参照
# => array([[1, 2, 3],
#        [4, 5, 6]])

arrf = np.arange(32).reshape((8,4))
arrf # => array([[ 0,  1,  2,  3],
#        [ 4,  5,  6,  7],
#        [ 8,  9, 10, 11],
#        [12, 13, 14, 15],
#        [16, 17, 18, 19],
#        [20, 21, 22, 23],
#        [24, 25, 26, 27],
#        [28, 29, 30, 31]])
arrf[[1,5,7,2]][:,[0,3,1,2]] # ファンシーインデックス参照
# => array([[ 4,  7,  5,  6],
#        [20, 23, 21, 22],
#        [28, 31, 29, 30],
#        [ 8, 11,  9, 10]])
pandas によるデータ構造の再定義
NumPy だけでも非常に有益なのですが pandas ではさらに R ライクなデータ構造を提供しています。これがシリーズ (Series) とデータフレーム (DataFrame) です。データフレームという言葉は R でも頻出しますので R を使ったことのあるかたは聞き慣れているでしょう。シリーズは 1 次元の配列のようなオブジェクトで、データフレームはテーブル形式の行と列によるデータ構造を持ちます。
pandas + matplotlib によるプロッティング
昨日までの記事の中にしばしば出てきた matplotlib はデータ可視化における強力なライブラリです。これを pandas と組み合わせることでデータ分析結果をさまざまに描画して可視化することができます。詳細な説明は教科書や公式サイトに譲るとしてさっそく手を動かしてみましょう。
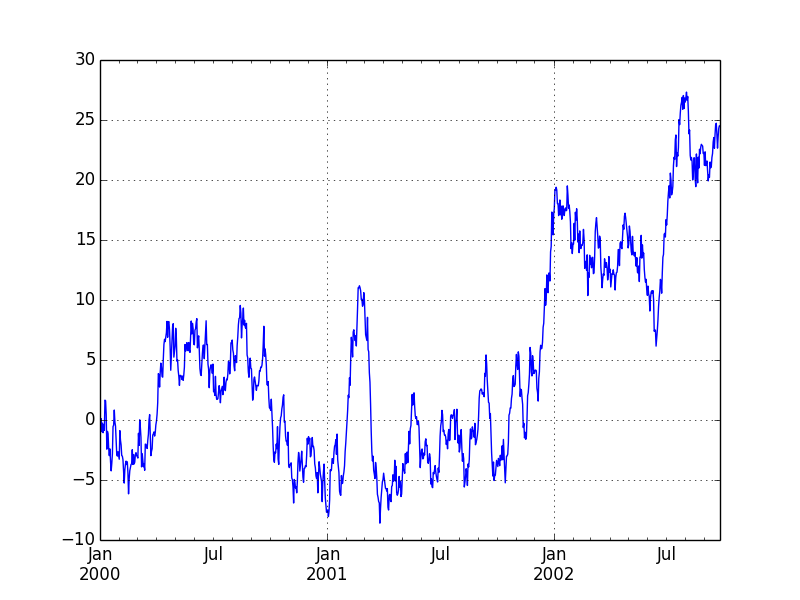
シリーズのプロッティング
from pylab import *
from pandas import *
import matplotlib.pyplot as plt
import numpy as np
ts = Series(randn(1000), index=date_range('1/1/2000', periods=1000))
ts = ts.cumsum()
ts.plot()
plt.show()
plt.savefig("image.png")
データフレームのプロッティング
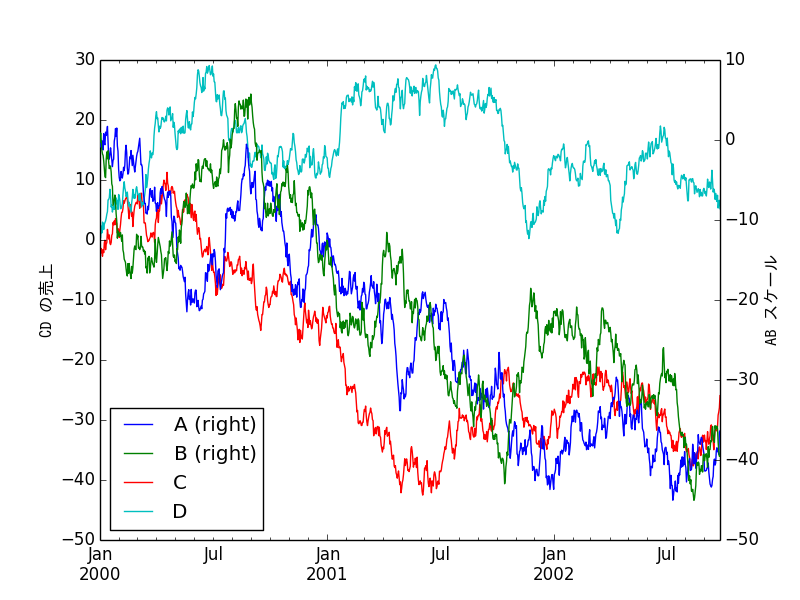
matplotlib で日本語を扱うためにはフォントの指定が必要です。試しに日本語を利用してみましょう。
# -*- coding: utf-8 -*-
from pylab import *
from pandas import *
import matplotlib.pyplot as plt
import numpy as np
from matplotlib import font_manager # 日本語を使うために必要
fontprop = matplotlib.font_manager.FontProperties(fname="/usr/share/fonts/truetype/fonts-japanese-gothic.ttf") # フォントファイルの場所を指定
df = DataFrame(randn(1000, 4), index=ts.index, columns=list('ABCD'))
df = df.cumsum()
plt.figure()
df.plot()
plt.legend(loc='best')
ax = df.plot(secondary_y=['A', 'B'])
ax.set_ylabel('CD の売上', fontdict = {"fontproperties": fontprop})
ax.right_ax.set_ylabel('AB スケール', fontdict = {"fontproperties": fontprop})
plt.show()
plt.savefig("image2.png")
日本語が表示されました。実際にはもう少しフォントのパラメーターを調整したほうが良いでしょう。
サブプロッティング
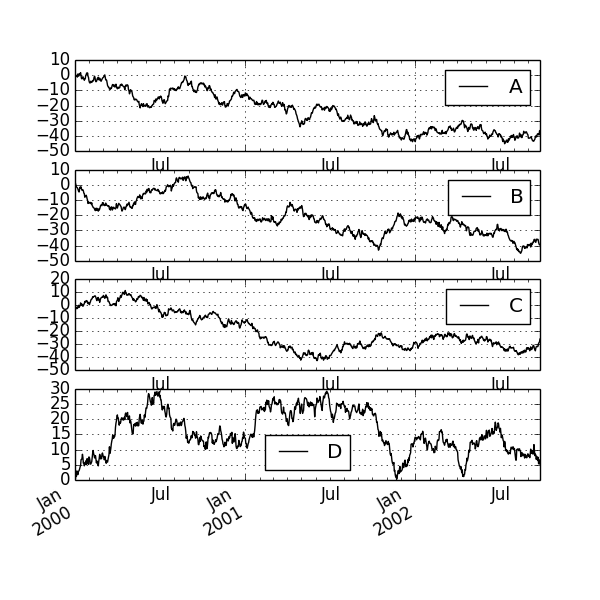
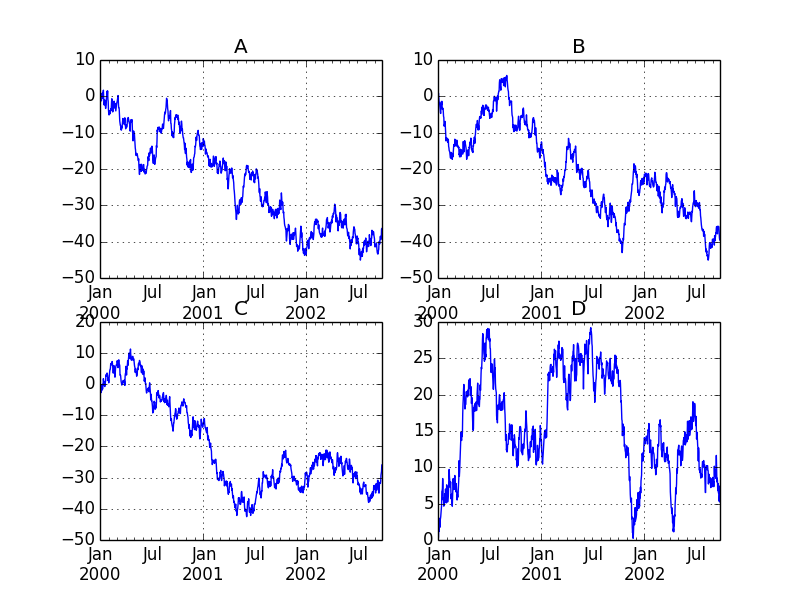
matplotlib ではプロットの中にプロットを描くサブプロッティングもできます。
df.plot(subplots=True, figsize=(6, 6)); plt.legend(loc='best')
plt.show()
plt.savefig("image3.png")
fig, axes = plt.subplots(nrows=2, ncols=2)
df['A'].plot(ax=axes[0,0]); axes[0,0].set_title('A')
df['B'].plot(ax=axes[0,1]); axes[0,1].set_title('B')
df['C'].plot(ax=axes[1,0]); axes[1,0].set_title('C')
df['D'].plot(ax=axes[1,1]); axes[1,1].set_title('D')
plt.show()
plt.savefig("image4.png")
棒グラフのプロッティング
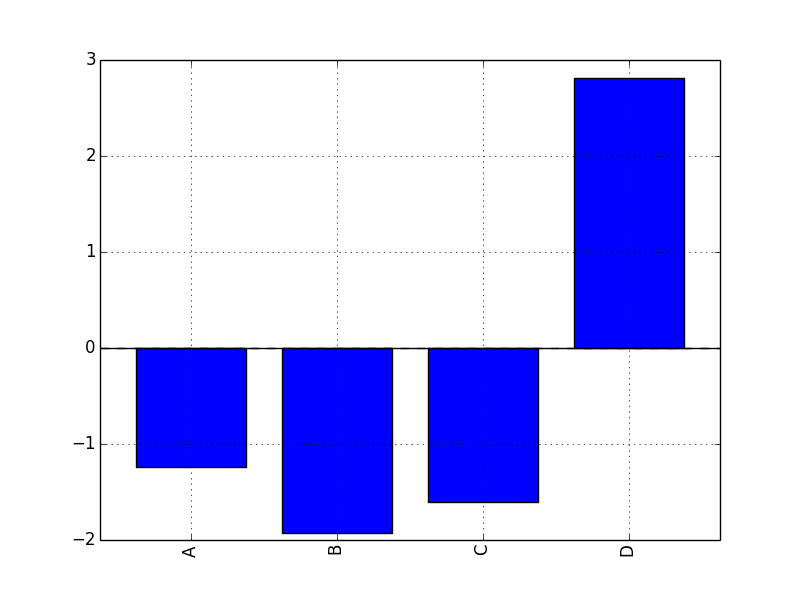
plt.figure();
df.ix[5].plot(kind='bar'); plt.axhline(0, color='k')
plt.show()
plt.savefig("image5.png")
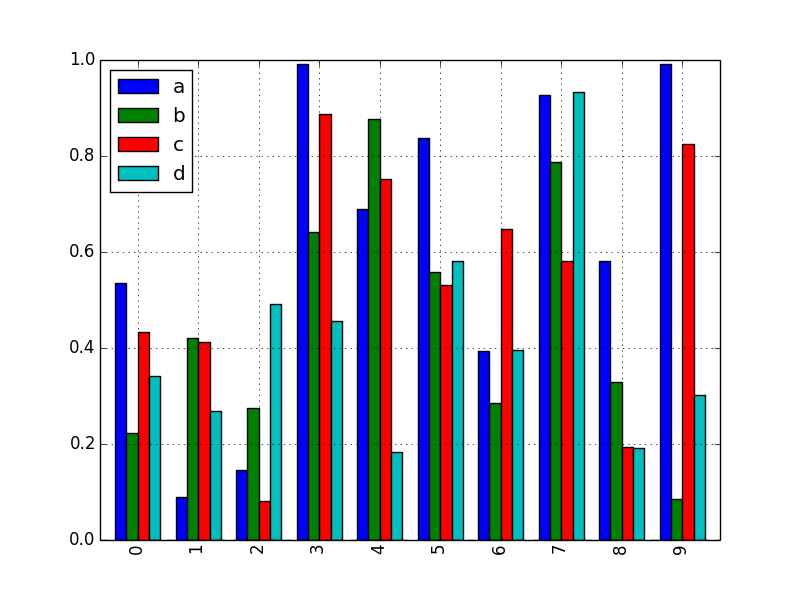
df2 = DataFrame(rand(10, 4), columns=['a', 'b', 'c', 'd'])
df2.plot(kind='bar');
plt.show()
plt.savefig("image6.png")
棒グラフのサブプロッティング
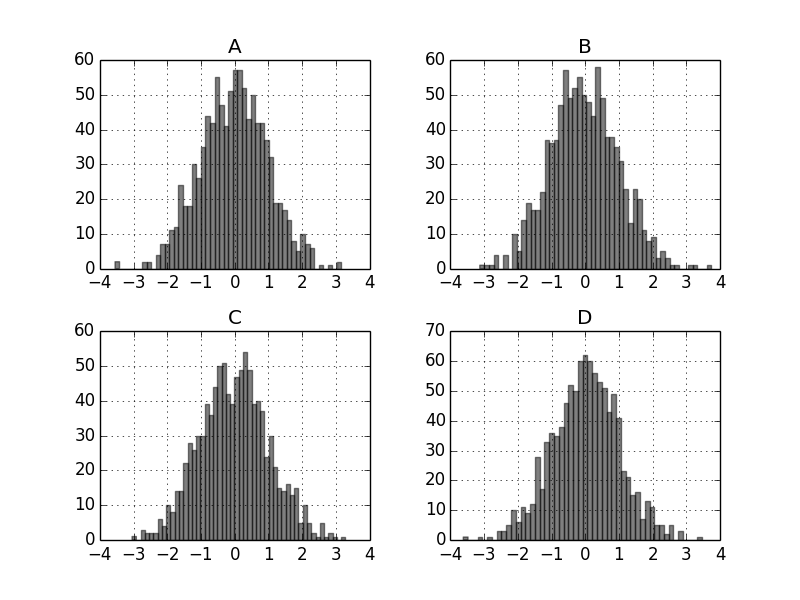
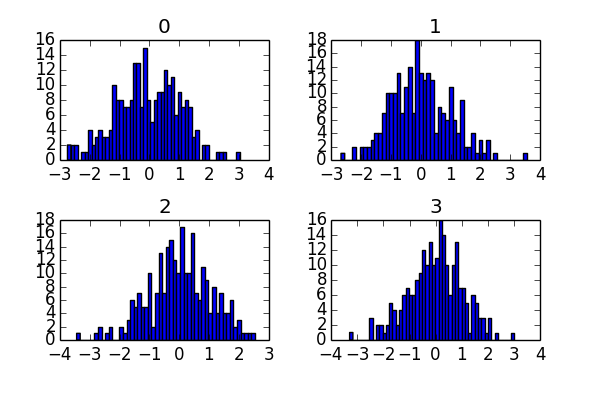
もちろん棒グラフでも (他のいずれでも) サブプロッティングが可能です。
df.diff().hist(color='k', alpha=0.5, bins=50)
plt.show()
plt.savefig("image8.png")
data = Series(randn(1000))
data.hist(by=randint(0, 4, 1000), figsize=(6, 4))
plt.show()
plt.savefig("image9.png")
さまざまなデータ可視化
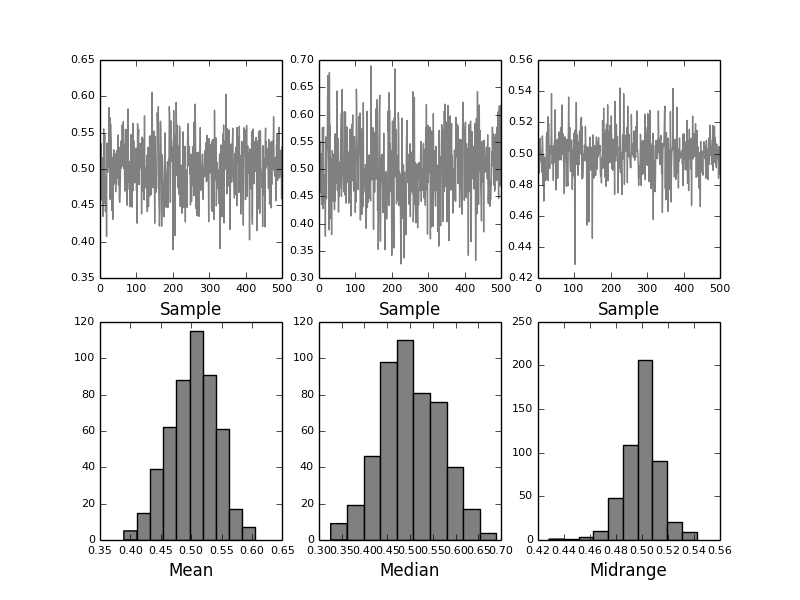
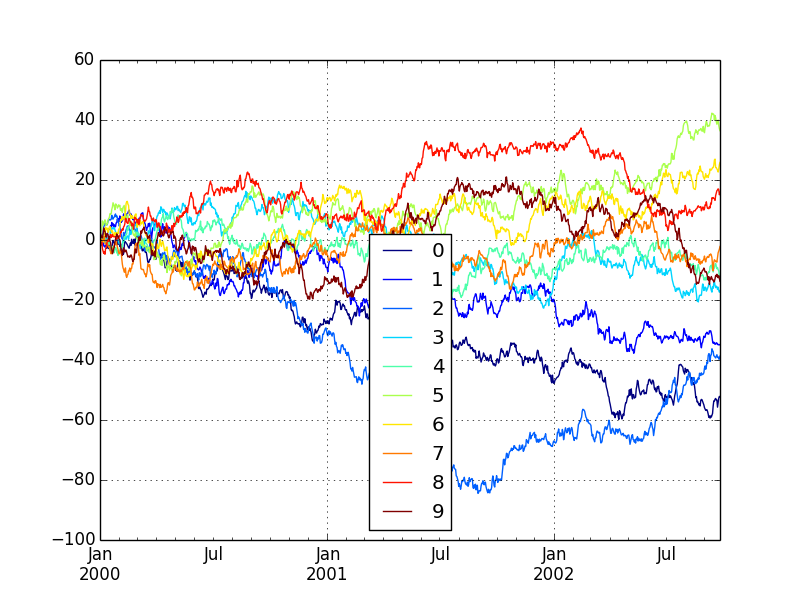
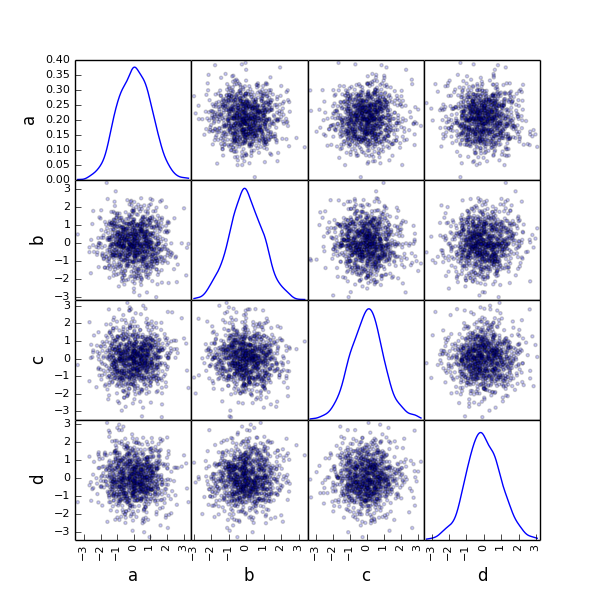
matplotlib は他にも実にさまざまなグラフをプロッティングできるのですが、その一部を紹介します。
from pandas.tools.plotting import bootstrap_plot
data = Series(rand(1000))
bootstrap_plot(data, size=50, samples=500, color='grey')
plt.show()
plt.savefig("image12.png")
df = DataFrame(randn(1000, 10), index=ts.index)
df = df.cumsum()
plt.figure()
df.plot(colormap='jet')
plt.show()
plt.savefig("image13.png")
dd = DataFrame(randn(10, 10)).applymap(abs)
dd = dd.cumsum()
plt.figure()
dd.plot(kind='bar', colormap='Greens')
plt.show()
plt.savefig("image14.png")
from pandas.tools.plotting import scatter_matrix
df = DataFrame(randn(1000, 4), columns=['a', 'b', 'c', 'd'])
scatter_matrix(df, alpha=0.2, figsize=(6, 6), diagonal='kde')
plt.show()
plt.savefig("image11.png")
考察
NumPy で高度なベクトル演算が、 pandas で R ライクなデータ構造が、そして matplotlib でそれらによる計算結果をわかりやすく可視化できることがわかりました。これだけ強力なツールがあればデータ分析においても大変心強いですね。統計や機械学習では線形代数に係る計算がほぼ必須ともいえるほど頻出しますが、そのような知識と共にまずはこれらのライブラリに慣れておくことが大切です。
参考
詳解はそれぞれの公式サイトの情報を参照すると良いでしょう。
NumPy
http://www.numpy.org/
pandas
http://pandas.pydata.org/
matplotlib
http://matplotlib.org/#
