今日は R でできる、ちょっとした小技を紹介します。
クリップボードからのデータ取り込み
R プロンプトの準備
R のプロンプトで次のように文字を入力します。 (エンターキーは押しません)
x = scan("clipboard")
なお上記は GNU/Linux または Windows の場合で、 Mac の場合は次のようにします。
x = scan(pipe("pbpaste"))
データをクリップボードに格納する
この状態で Excel などのスプレッドシートや、あるいはターミナルやウェブページなどから、取り込みたい数字の集合を選択してコピーし、クリップボードに格納します。
クリップボードから R にデータを読み込む
ここで R プロンプトから上記コマンドを入力すると、クリップボードからデータを取り込むことができます。
x = scan("clipboard")
# => Read 15 items
# (15 件のデータが取り込まれた)

x
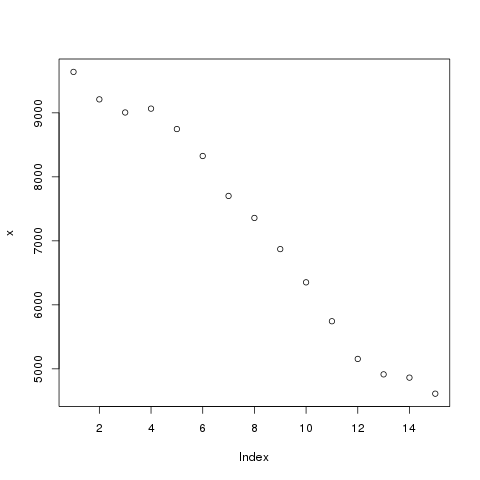
# => [1] 9640 9211 9006 9066 8747 8326 7702 7358 6871 6352 5744 5155 4914 4863 4612

# 標準偏差を求める
sd(x)
# => [1] 1796.451

# プロッティングする
plot(x)
この技を覚えておけば、ちょっとしたデータをすぐに R に取り込んで統計関数を使ったりデータ可視化をすることができます。
画像ファイルに保存する
# 画像ファイルに保存する
png("image.png", width = 480, height = 480, pointsize = 12, bg = "white", res = NA)
データをファイルに保存する
クリップボードから取り込んだデータは write または write.table (データフレームの場合) でファイルに保存することができます。
write(x, "hoge.txt")
参考
R の初歩
http://oku.edu.mie-u.ac.jp/~okumura/stat/first.html
奥村先生のページには他にも R や統計に関する情報が実に豊富にあるので適宜参照すると良いでしょう。
http://oku.edu.mie-u.ac.jp/~okumura/stat/
