前回まで延々と続いていたデータ可視化の話も今回で最終回です。
散布図
前回と同様 pydata-book のデータを利用します。
pydata-book/ch08/macrodata.csv
https://github.com/pydata/pydata-book/blob/master/ch08/macrodata.csv
import numpy as np
from pandas import *
import matplotlib.pyplot as plt

# CSV データを読み込む
macro = read_csv('macrodata.csv')

# いくつかの列をピックアップする
data = macro[['cpi', 'm1', 'tbilrate', 'unemp']]

# .diff() メソッドは値をひとつ前の行からの差分に変更する
# 先頭が NaN になるので .dropna() メソッドで取り除く
trans_data = np.log(data).diff().dropna()

# trans_data は前行からの変化を示すデータセットになる
# 最後の 5 行を表示
print( trans_data[-5:] )
# =>
#           cpi        m1  tbilrate     unemp
# 198 -0.007904  0.045361 -0.396881  0.105361
# 199 -0.021979  0.066753 -2.277267  0.139762
# 200  0.002340  0.010286  0.606136  0.160343
# 201  0.008419  0.037461 -0.200671  0.127339
# 202  0.008894  0.012202 -0.405465  0.042560

# 2 つの列から散布図をプロッティング
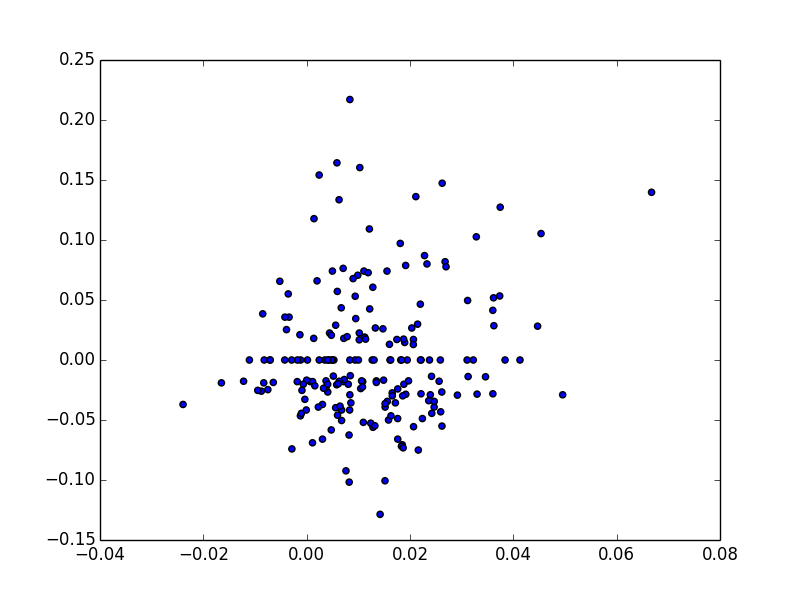
plt.scatter(trans_data['m1'], trans_data['unemp'])

plt.show()
plt.savefig("image.png")
散布図行列
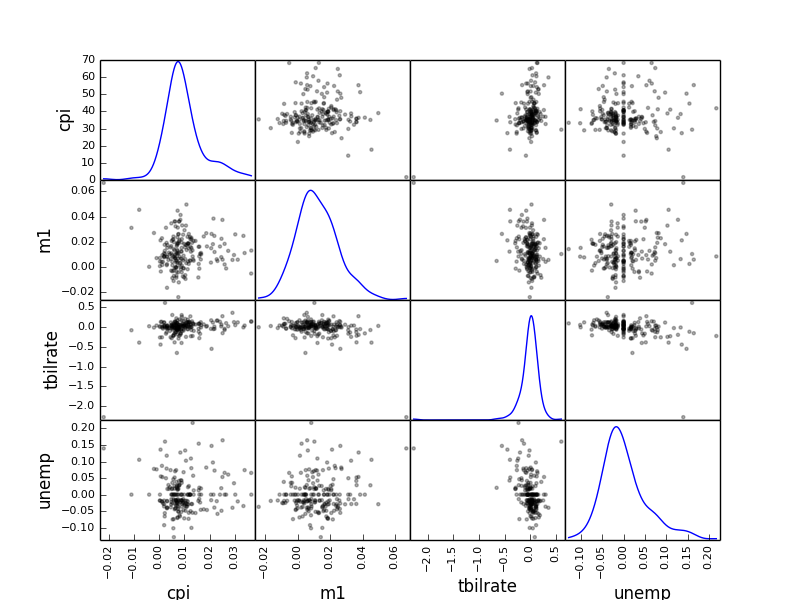
一連の変数のすべてのペアを散布図にしたのが散布図行列です。 scatter_matrix 関数でこれを作成することができます。
# 散布図行列を生成
from pandas.tools.plotting import scatter_matrix
scatter_matrix(trans_data, diagonal='kde', color='k', alpha=0.3)

plt.show()
plt.savefig("image2.png")
任意の 2 つの 1 次元データの相関を見るとき、シンプルで強力な方法として役立ちます。
参考
Pythonによるデータ分析入門――NumPy、pandasを使ったデータ処理
http://www.oreilly.co.jp/books/9784873116556/

