前々回、前回に引き続いて matplotlib によるデータ可視化に焦点を当てていきます。今回から pandas との組み合わせによる合わせ技となります。
折れ線グラフ
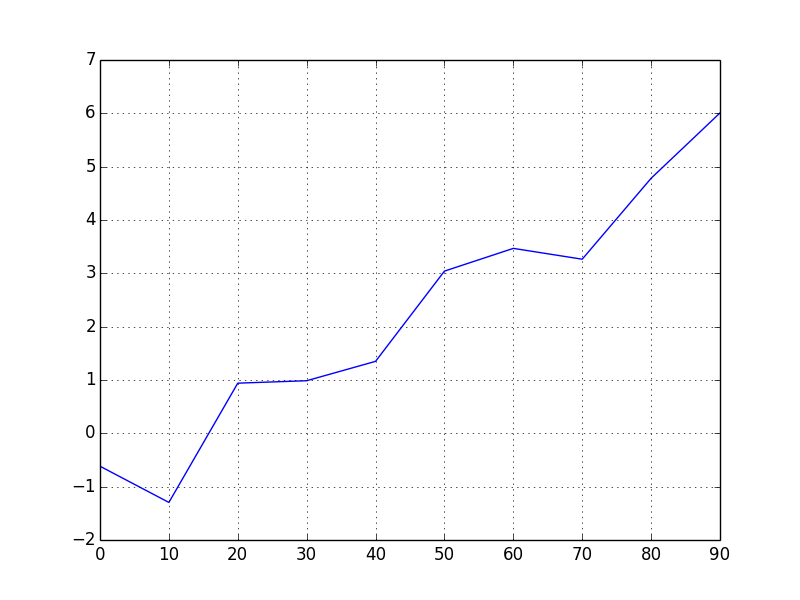
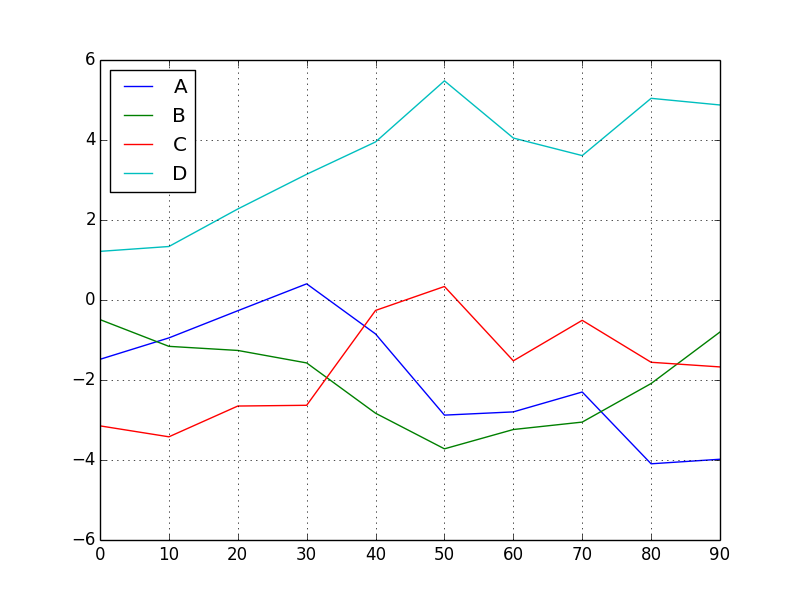
シリーズやデータフレームのオブジェクトをプロットすると、デフォルトでは折れ線グラフとなります。
import numpy as np
from pandas import *
from pylab import *
import matplotlib.pyplot as plt
from numpy.random import randn

# シリーズの単純なプロッティング
s = Series(np.random.randn(10).cumsum(), index=np.arange(0, 100, 10))
s.plot()

plt.show()
plt.savefig("image.png")
# データフレームの単純なプロッティング
df = DataFrame(np.random.randn(10, 4).cumsum(0),
               columns=['A','B','C','D'],
               index=np.arange(0, 100, 10))
df.plot()
plt.show()
plt.savefig("image2.png")
pandas のプロット用のメソッドの大半にはオプションで ax パラメーターに matplotlib のサブプロットオブジェクトを指定できます。
plot に指定できるオプションの一覧としては以下の公式ドキュメントを参照するのが良いでしょう。
pandas.DataFrame.plot
http://pandas.pydata.org/pandas-docs/version/0.13.1/generated/pandas.DataFrame.plot.html
棒グラフ
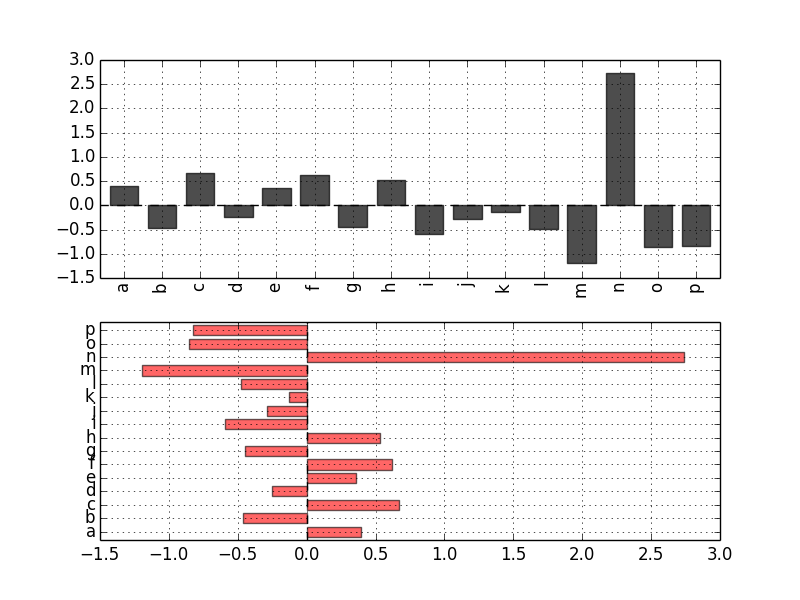
とくによく利用するのは kind でこれは線種を指定できます。 kind = 'bar' とすると棒グラフになります。
# シリーズを可視化する
data = Series(np.random.randn(16), index=list('abcdefghijklmnop'))
# 縦の棒グラフ
data.plot(kind='bar', ax=axes[0], color='k', alpha=0.7)
# 横の棒グラフ
data.plot(kind='barh', ax=axes[1], color='r', alpha=0.6)

plt.show()
plt.savefig("image3.png")
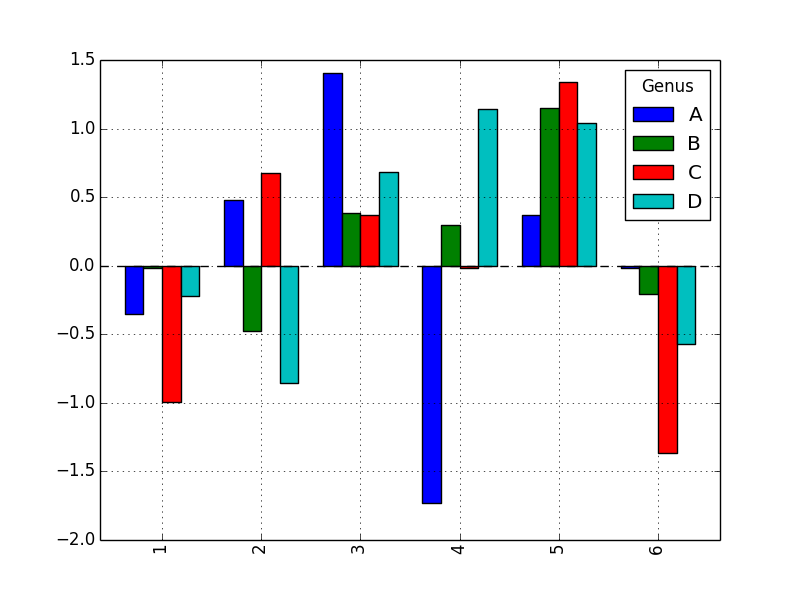
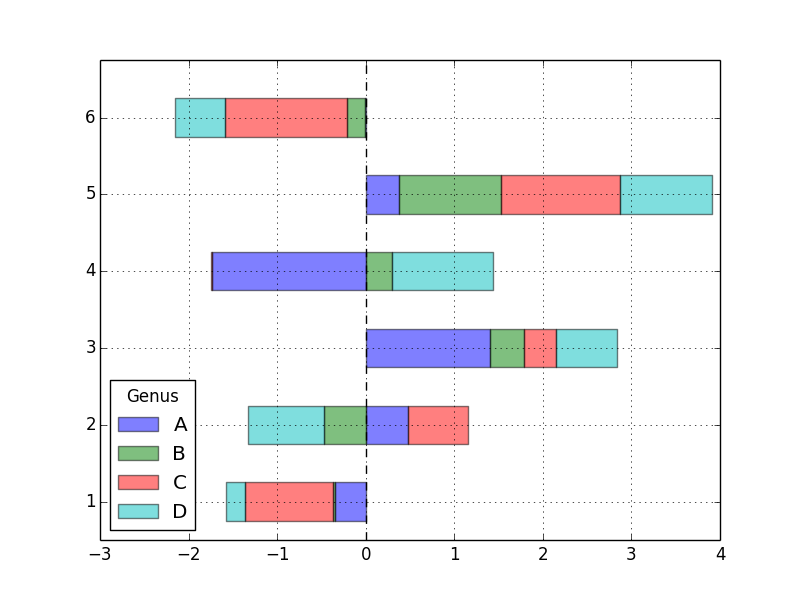
データフレームを棒グラフにした場合、各行の値はグループとしてまとめられます。
# データフレームを可視化する
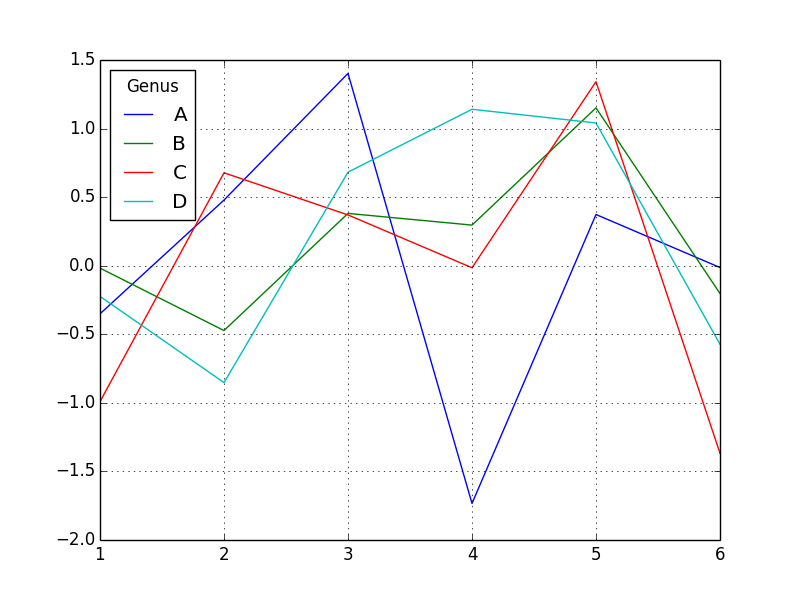
df = DataFrame(np.random.randn(6, 4),
               index=['1','2','3','4','5','6'],
               columns=Index(['A','B','C','D'], name='Genus'))

print( df )
# =>
# Genus         A         B         C         D
# 1     -0.350817 -0.017378 -0.991230 -0.223608
# 2      0.478712 -0.472764  0.677484 -0.852312
# 3      1.402219  0.381440  0.370080  0.682125
# 4     -1.733590  0.296124 -0.014841  1.140705
# 5      0.373399  1.150718  1.341984  1.040759
# 6     -0.013301 -0.202793 -1.367493 -0.572954

df.plot()
plt.show()
plt.savefig("image4.png")

df.plot(kind='bar') # 棒グラフにする
plt.show(grid=False, alpha=0.8)
plt.savefig("image5.png")

df.plot(kind='barh', stacked=True, alpha=0.5) # 積み上げ棒グラフにする (stacked オプション)
plt.show()
plt.savefig("image6.png")
金融データを可視化する
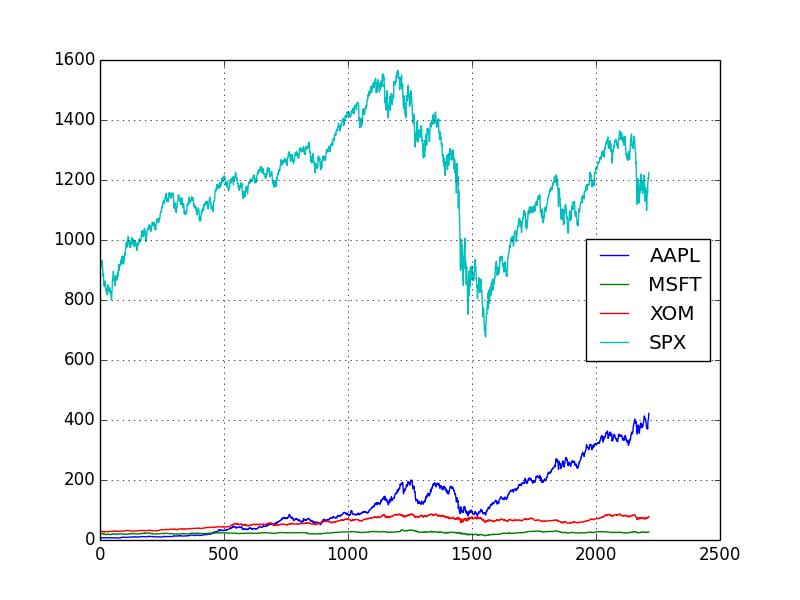
以前の金融データの分析とその可視化の回で使った csv を利用し pandas + matplotlib でプロッティングしてみます。
df = read_csv('stock_px.csv') # CSV を読み込む

print( df.head(10) ) # データフレームの先頭
# =>
# [6 rows x 4 columns]
#             Unnamed: 0  AAPL   MSFT    XOM     SPX
# 0  2003-01-02 00:00:00  7.40  21.11  29.22  909.03
# 1  2003-01-03 00:00:00  7.45  21.14  29.24  908.59
# 2  2003-01-06 00:00:00  7.45  21.52  29.96  929.01
# 3  2003-01-07 00:00:00  7.43  21.93  28.95  922.93
# 4  2003-01-08 00:00:00  7.28  21.31  28.83  909.93
# 5  2003-01-09 00:00:00  7.34  21.93  29.44  927.57
# 6  2003-01-10 00:00:00  7.36  21.97  29.03  927.57
# 7  2003-01-13 00:00:00  7.32  22.16  28.91  926.26
# 8  2003-01-14 00:00:00  7.30  22.39  29.17  931.66
# 9  2003-01-15 00:00:00  7.22  22.11  28.77  918.22

df.plot()
plt.show()
plt.savefig("image7.png")
CSV のデータをいとも簡単に可視化することができました。
