matplotlib と pandas によるさまざまな図の描画方法を以前に紹介しました。しかしその具体的なパラメーターについては触れませんでした。今回から数回に渡り matplotlib による図形描画について追っていこうと思います。
図とサブプロット
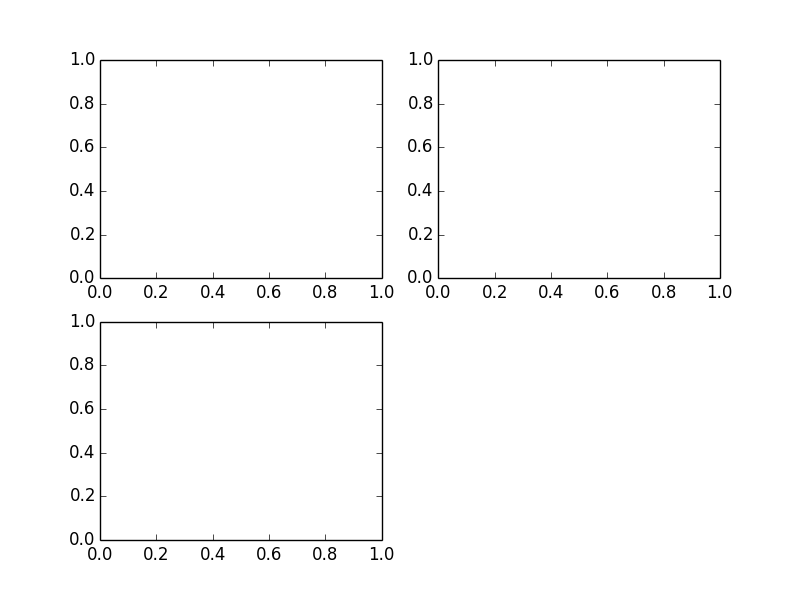
matplotlib の Figure オブジェクトはプロット機能を提供します。 plt.figure() メソッドは何も描画されていない新しいウィンドウを描画します。 add_subplot() メソッドはその内部にサブプロットを生成します。
import numpy as np
from pandas import *
from pylab import *
import matplotlib.pyplot as plt
from matplotlib import font_manager
from numpy.random import randn

# 日本語を使うため必要
fontprop = matplotlib.font_manager.FontProperties(fname="/usr/share/fonts/truetype/fonts-japanese-gothic.ttf")

# 新規のウィンドウを描画
fig = plt.figure()

# サブプロットを追加
ax1 = fig.add_subplot(2,2,1)
ax2 = fig.add_subplot(2,2,2)
ax3 = fig.add_subplot(2,2,3)

plt.show()
plt.savefig("image.png")
サブプロットへのデータ描画
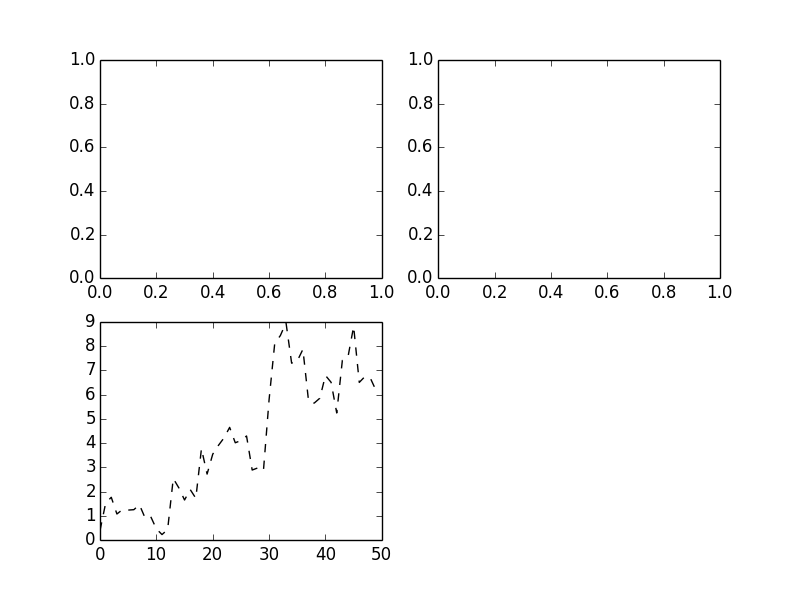
plot をすると matplotlib は使用した図やサブプロットのうち一番最後のものに描画します。
ran = randn(50).cumsum()
# 黒色 (k) の破線で描画する
plt.plot(ran, 'k--')

plt.show()
plt.savefig("image2.png")
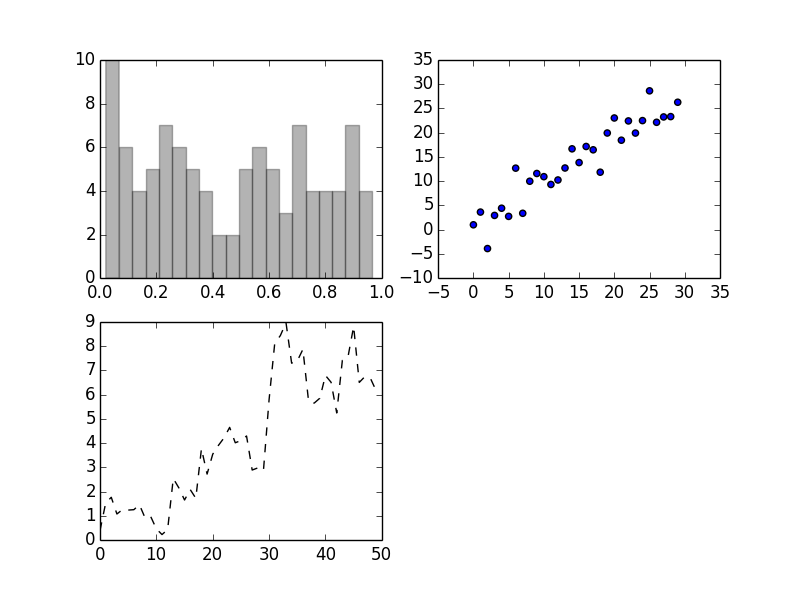
サブプロットのインスタンスメソッドを明示的に呼び出すことで、任意のサブプロットに描画できます。
ax1.hist(rand(100), bins=20, color='k', alpha=0.3)
ax2.scatter(np.arange(30), np.arange(30) + 3 * randn(30))

plt.show()
plt.savefig("image3.png")
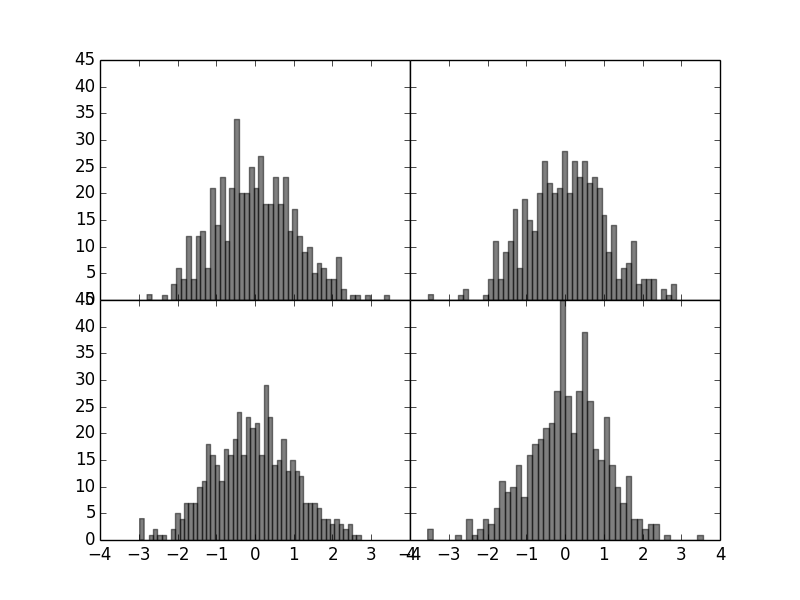
スペースの調整をする
サブプロット間のスペースの調整には subplots_adjust メソッドを使います。
fig, axes = plt.subplots(2, 2, sharex=True, sharey=True)
for i in range(2):
    for j in range(2):
        axes[i, j].hist(randn(500), bins=50, color='k', alpha=0.5)

# サブプロット間の空白を詰めてみる
plt.subplots_adjust(left=None, bottom=None, right=None, top=None, wspace=0, hspace=0)

plt.show()
plt.savefig("image4.png")
参考
Pythonによるデータ分析入門――NumPy、pandasを使ったデータ処理
http://www.oreilly.co.jp/books/9784873116556/