10
10

Delete article

Deleted articles cannot be recovered.

Draft of this article would be also deleted.

Are you sure you want to delete this article?

More than 5 years have passed since last update.

オープンソースのデータ可視化ツールのre:dashでらくらく分析共有 その4 〜 pivot table編

Last updated at Posted at 2016-01-27

今回はpivot tableについて扱います。pivot tableはExcelやGoogle Spreadsheetsでも扱えるので知っている人も多いと思います。
pivot tableを使ってクロス集計を行うことができます。クロス集計についてはここらへんを見てみてください。

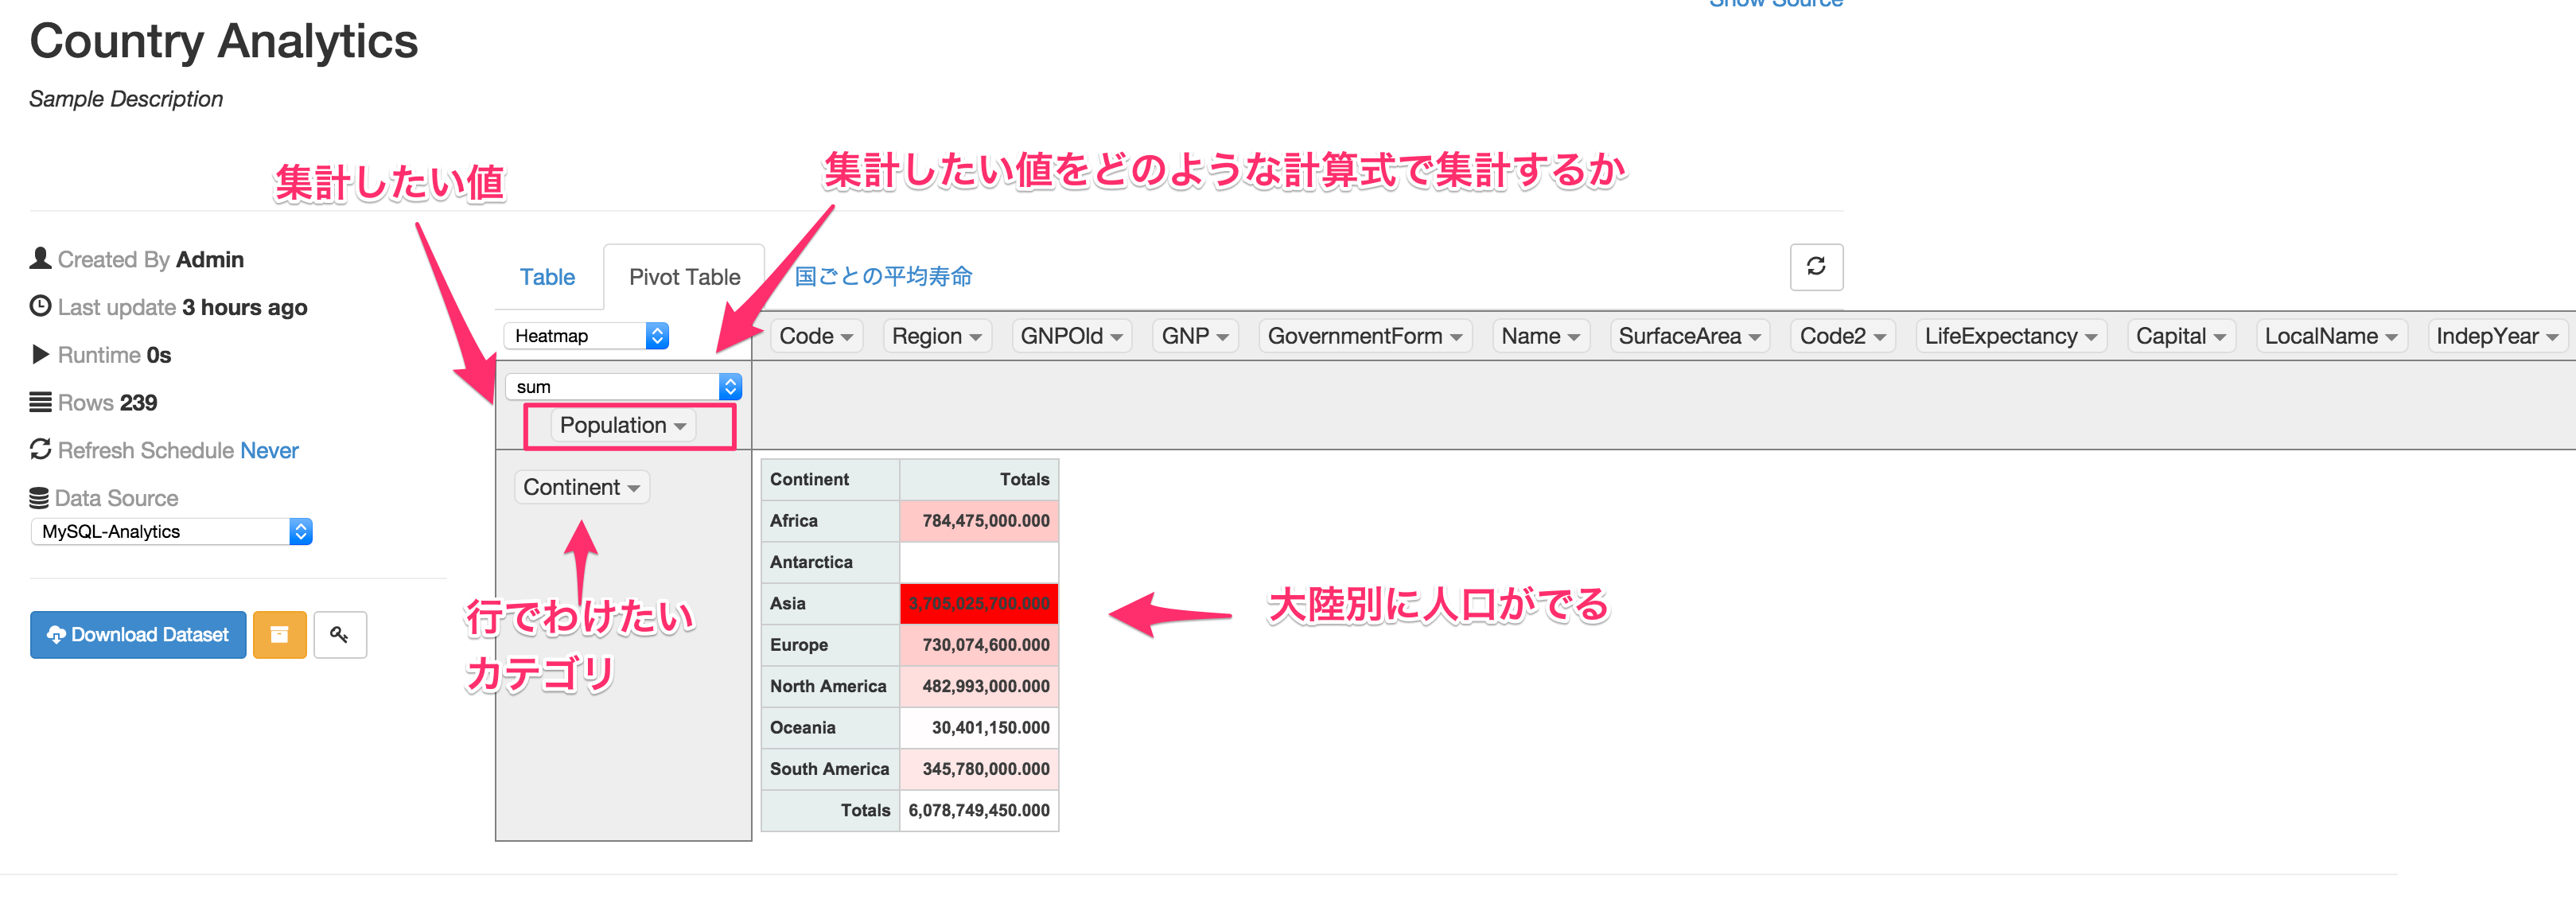
その1で作ったCountryデータを使います。

re_dash___Country_Analytics.png

と、ここまでやって思ったのですが、Excelのほうが早くて便利なので、Excel使ったほうがいいかもと思いました。
ただ、DownloadしてExcelで開かなくてもWeb上でできるので楽っちゃらくです。
10
10
0

Register as a new user and use Qiita more conveniently

  1. You get articles that match your needs
  2. You can efficiently read back useful information
  3. You can use dark theme
What you can do with signing up
10
10

Delete article

Deleted articles cannot be recovered.

Draft of this article would be also deleted.

Are you sure you want to delete this article?