前置き
衝撃のサンプルとはGoogle公式の以下です。
財務時系列データを使用した機械学習
まだ機械学習まで到達できませんが、とても勉強になりました。
ひきつづき学習用データの作成を行っていきます。
前回のコード
import numpy as np
import pandas as pd
import matplotlib.pyplot as plt

# ダウンロードしてきたやつ
INDEIES = ["N225",  # Nikkei 225, Japan
           "HSI",   # Hang Seng, Hong Kong
           "GDAXI", # DAX, German
           "DJI",   # Dow, US
           "GSPC",  # S&P 500, US
           "SSEC",  # Shanghai Composite Index (China)
           "BVSP"]  # BOVESPA, Brazil
def study():
    closing = pd.DataFrame()
    for index in INDEIES:
        # na_valuesは文字列"null"のとき空として扱う CSVみるとnullって書いてあります。
        df = pd.read_csv("./data/" + index + ".csv",na_values=["null"])
        df["Date"] = pd.to_datetime(df["Date"])
        closing[index] = df["Close"]
    closing = closing.fillna(method="ffill")
    print(closing.describe())
    #グラフ表示
    closing.plot()
    plt.show()
if __name__ == "__main__":
    study()
学習させる前にデータの整理と確認が必要の続き
前の記事でデータを集めてグラフを表示するところまで行いました。
まだまだデータを整えていきます。
絶対値がインデックスにより違うのでそろえる
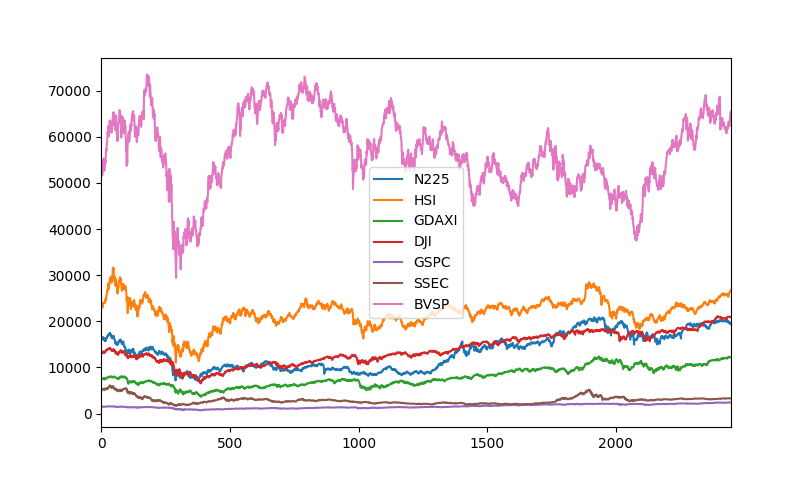
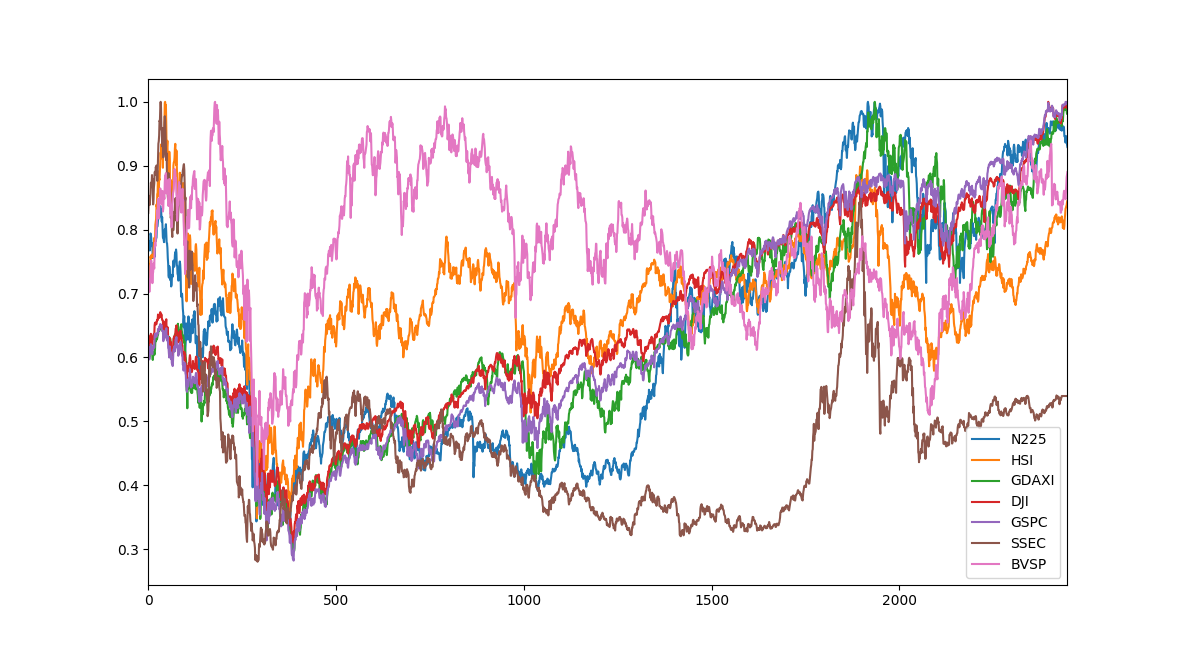
BVSP(ピンク)の絶対値が大きくGSPC(紫)はもはやどう動いているのかわかりません。
単純に各インデックスの最大値で全部割ってしまいます。
グラフ表示前に以下を追加。
    for index in INDEIES:
        closing[index] = closing[index] / max(closing[index])
インデックスがすべて0から1の間に収まり比較しやすくなりました。
だいたい同じような動きをしてそうですがSSECはあんまり関係なさそうな感じ。
これを正規化(normalization)というらしいです。
上がるか下がるかの判断にN225は10000円程度とかDJIは同じく10000位とかの情報はいらないということですね。
各インデックスで前のデータがどれだけ似ているかみる
from pandas.plotting import autocorrelation_plot

    fig = plt.figure()
    fig.set_figwidth(20)
    fig.set_figheight(15)
    for index in INDEIES:
        autocorrelation_plot(closing[index])
    plt.show()
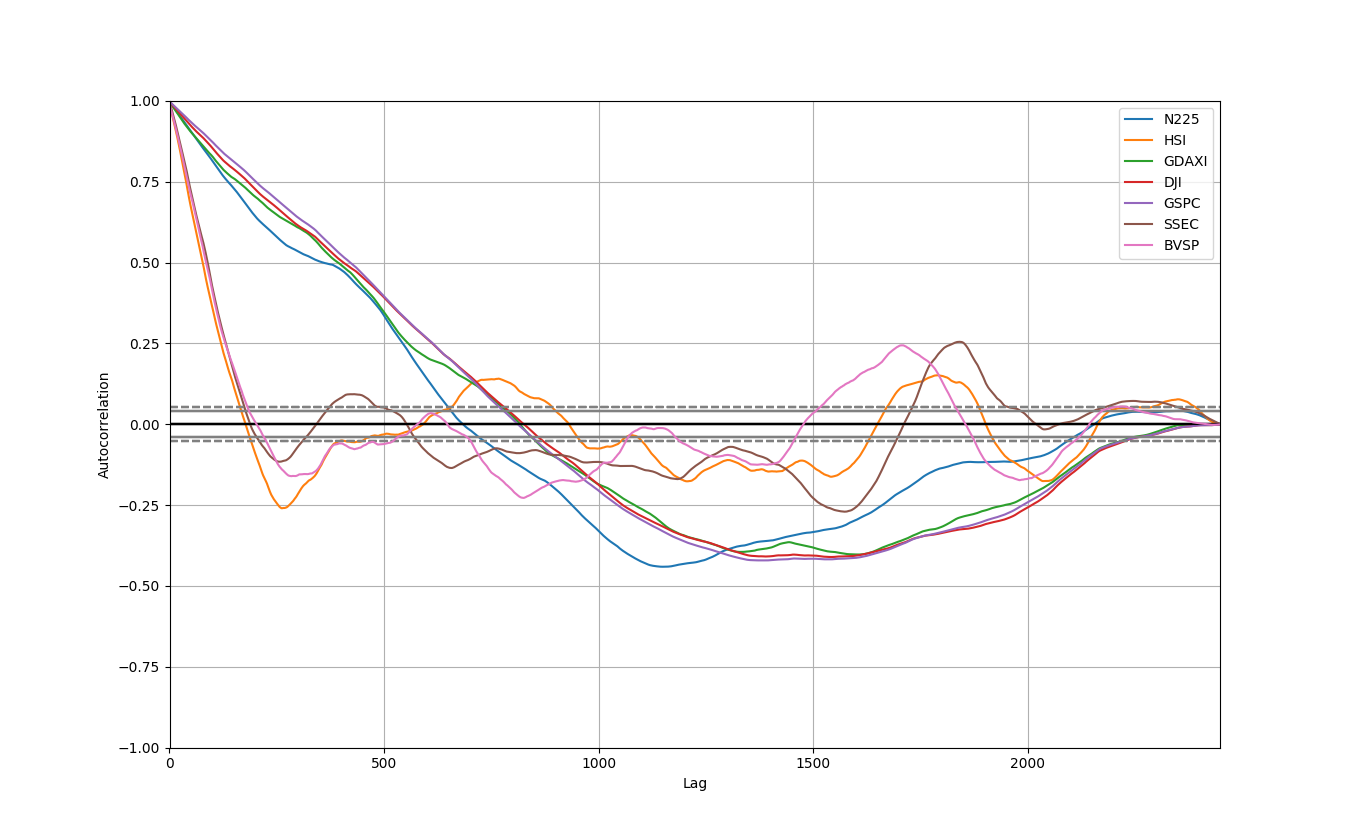
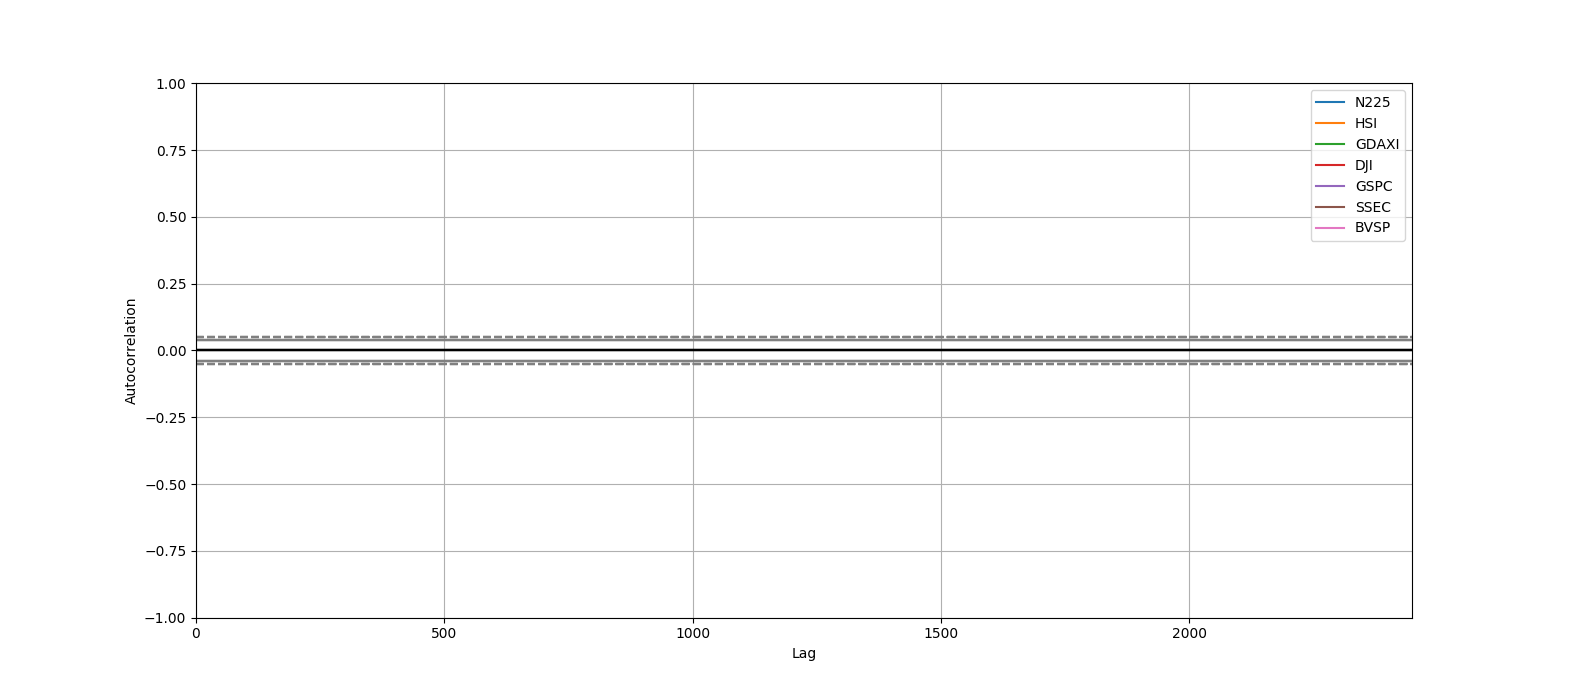
横軸がデータをさかのぼった数で縦軸は1がほとんど同じ動きで-1がほとんど真逆の動き。
すべて1から始まっているので1個前(1日前)のデータは当日のデータとすごい似ている
驚愕のサンプルは直前のデータはすごく似ているから大丈夫だね!でおわっています。
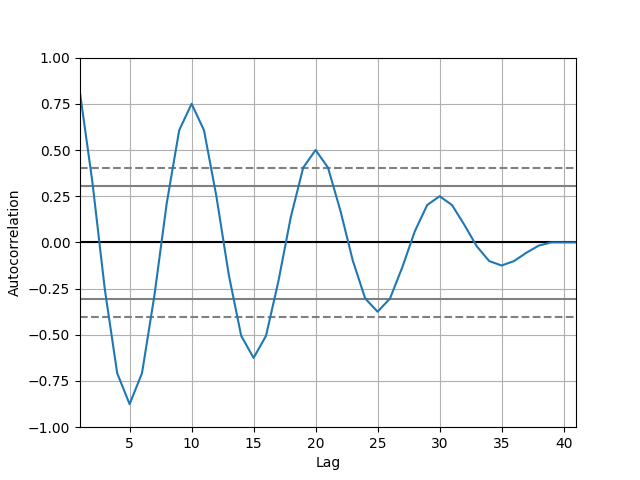
よくわからないので単純なsin波も同様にやってみます。
sin(0.2 * i * π) iは0から40です。
比較してわかることは
急激にさがっているインデックスは上下の激しい動きをする。
ゆるやかにさがっているインデックスはトレンドがながい。
0に収束していくので過去になるほど関係なくなる。
ということかしら。
似ている度合を相関(correlation)と呼び、1つの時系列データにおこなったものは自己相関というらしいです。
2つインデックスがどれだけ似ているか(相関があるか)見てみる。
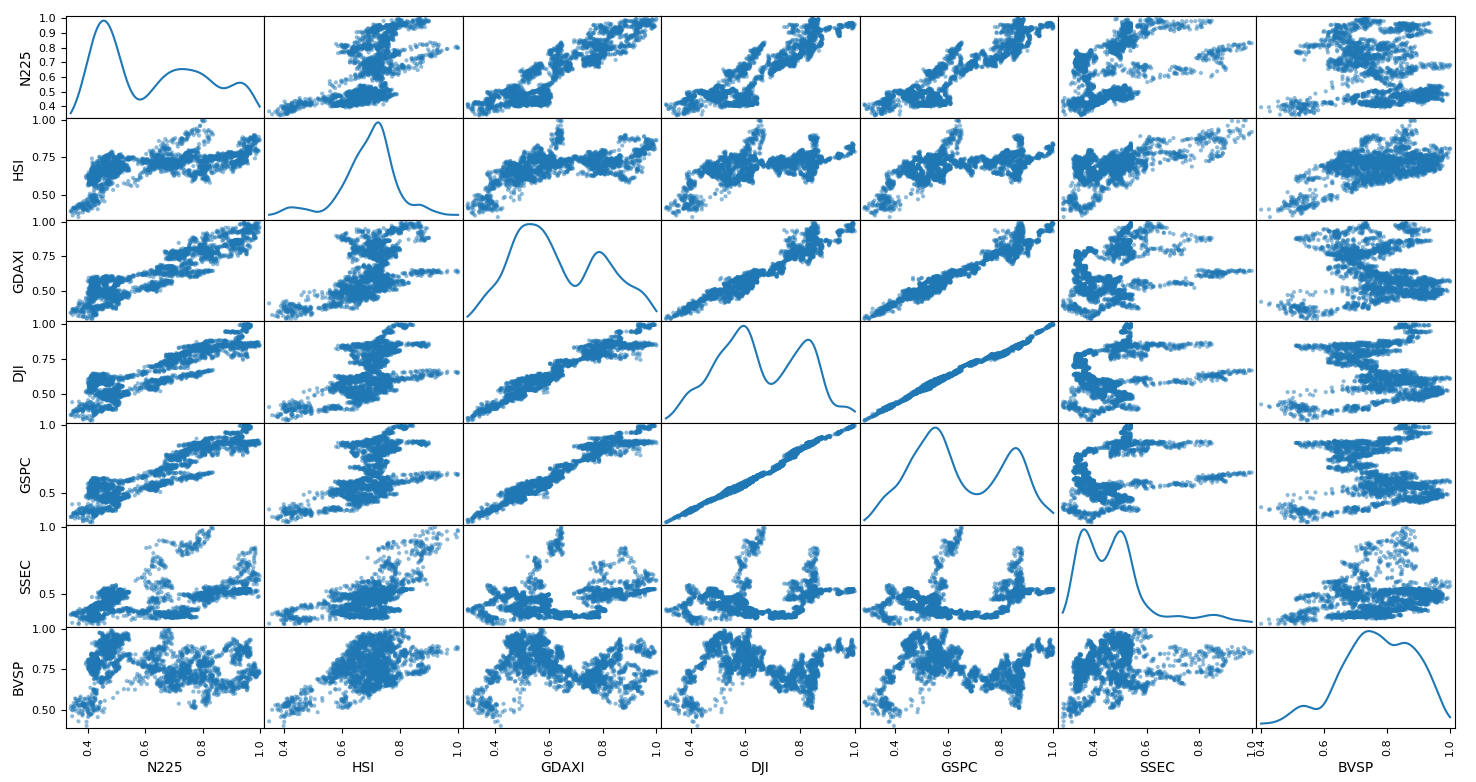
縦軸、横軸を2つのインデックスにし散布図を作成します。
似た動きをしている場合は線に近くなり、近くない場合はもわーと雲みたいになり視覚的にとらえられるそうです。
from pandas.plotting import scatter_matrix

    scatter_matrix(closing, figsize=(20, 20), diagonal='kde')
    plt.show()
うん GSPCとDJIがかなり似ているのはわかるんですがN225に近いのはDJIあたりでBVSPはN225とはあんまり関係なさそうってことかしら。
まだデータの整理が必要なんだそうです。
この図は散布図行列というそうです。
1個前のデータとの差分のLogを取る
参考 : 収益率の代わりに対数差分を用いられる理由
logged returnsと書いてありますが、対数差分?というそうです。
なんでですの?という所なんですが以下の理由があるそうです。
元の言葉は意味わからなすぎるので自分なりに把握した言葉にすると
- 後の利益率の計算が簡単
- 値動きの大きさによる影響を小さく
- トレンドの情報をなくす
1はのちのちつかうかもってことで、2,3に関してはなるべくsin波みたいに綺麗にしたいってことだと思います。
差を取ってlog取るだけなので計算は簡単です。
正規化した個所に1行追加します。
    for index in INDEIES:
        closing[index] = closing[index] / max(closing[index])
        closing[index] = np.log(closing[index] / closing[index].shift()) # << これ
またグラフで見てみます。
closingをそのままグラフにしたもの
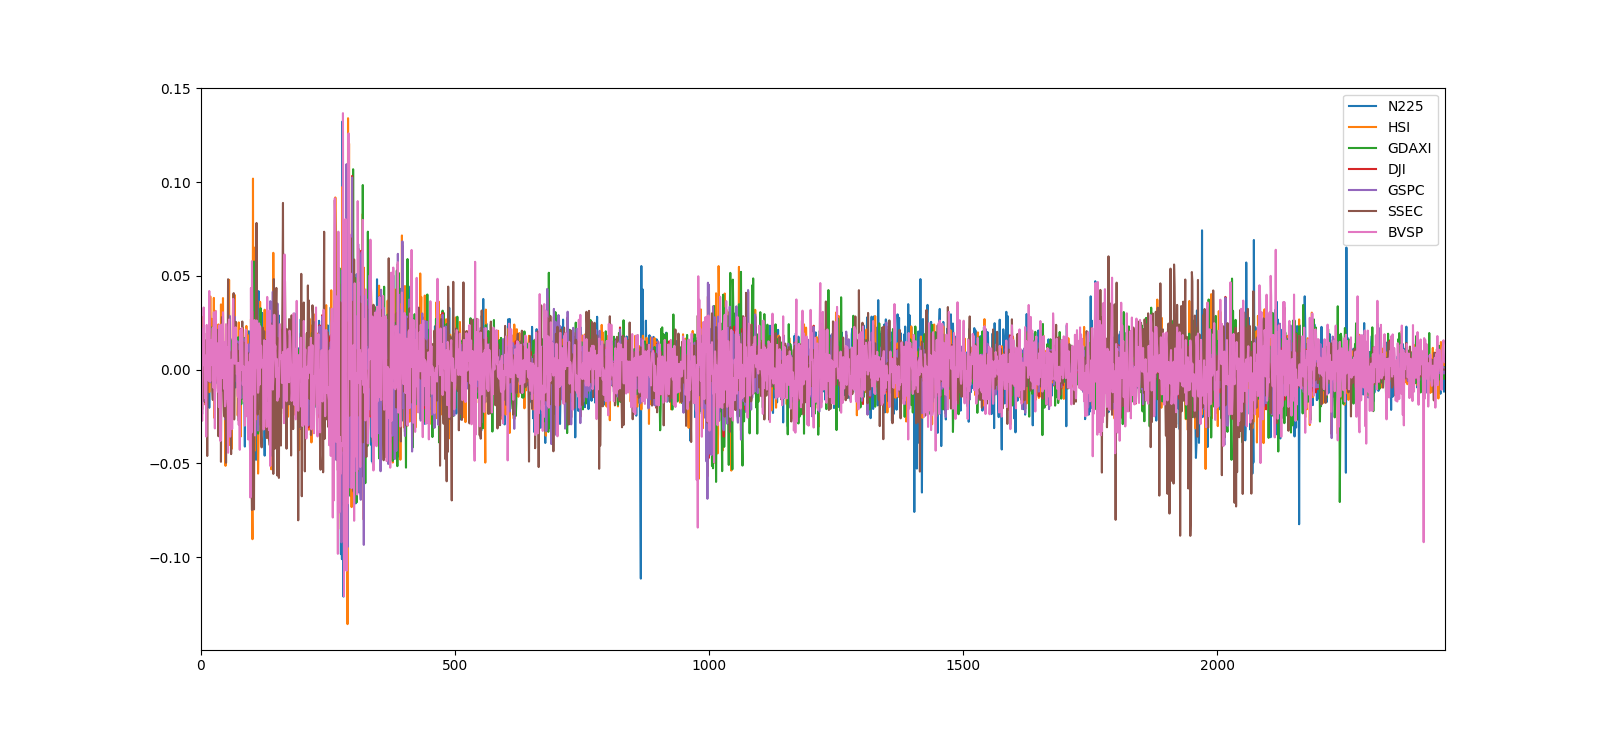
なるほど! わからん。
散布図行列
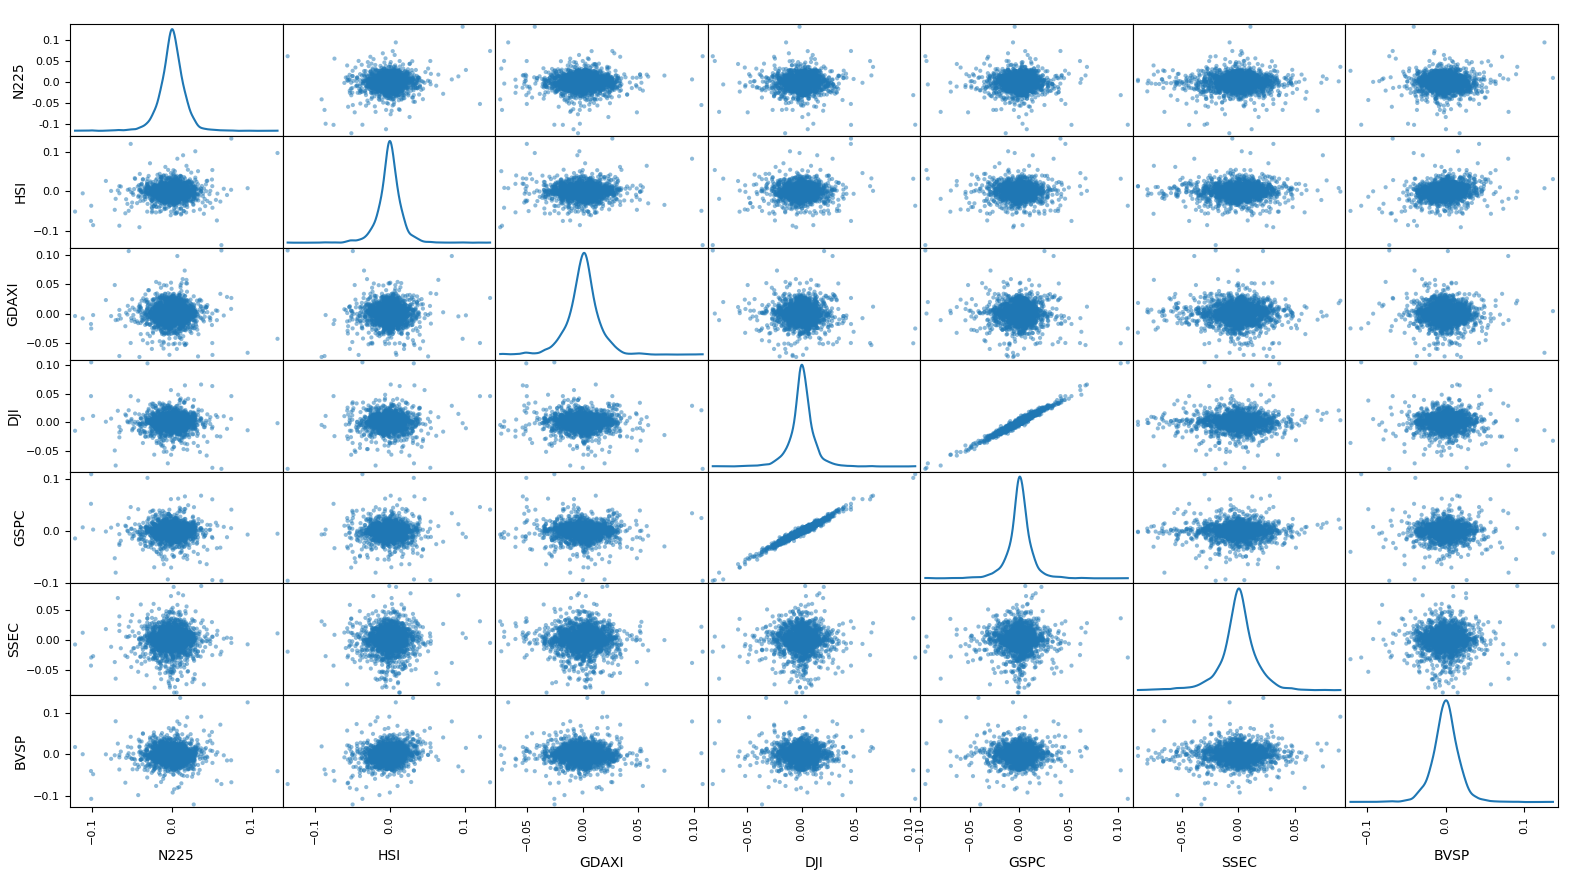
N225みるとなんか相関ありそうなのなくなっちゃんだけど大丈夫?大丈夫?
コードは以下の様になりました。
import numpy as np
import pandas as pd
import matplotlib.pyplot as plt
from pandas.plotting import autocorrelation_plot
from pandas.plotting import scatter_matrix
# ダウンロードしてきたやつ
INDEIES = ["N225",  # Nikkei 225, Japan
           "HSI",   # Hang Seng, Hong Kong
           "GDAXI", # DAX, German
           "DJI",   # Dow, US
           "GSPC",  # S&P 500, US
           "SSEC",  # Shanghai Composite Index (China)
           "BVSP"]  # BOVESPA, Brazil
def study():
    closing = pd.DataFrame()
    for index in INDEIES:
        # na_valuesは文字列"null"のとき空として扱う CSVみるとnullって書いてあります。
        df = pd.read_csv("./data/" + index + ".csv",na_values=["null"])
        df["Date"] = pd.to_datetime(df["Date"])
        df = df.set_index("Date")
        closing[index] = df["Close"]
    #空の部分は古いので埋める。
    closing = closing.fillna(method="ffill")
    print(closing.describe())
    for index in INDEIES:
        closing[index] = closing[index] / max(closing[index])
        closing[index] = np.log(closing[index] / closing[index].shift())
    #グラフ表示
    closing.plot()
    plt.show()

    #自己相関
    fig = plt.figure()
    fig.set_figwidth(20)
    fig.set_figheight(15)
    for index in INDEIES:
        autocorrelation_plot(closing[index], label=index)
    plt.show()

    #散布図行列
    scatter_matrix(closing, figsize=(20, 20), diagonal='kde')
    plt.show()
if __name__ == "__main__":
    study()
次に続きます。てかpython pandas matplotlibってすごい
前 TensorFlowを投資につかうまで 衝撃のサンプル編 (1)
次 TensorFlowを投資につかうまで 衝撃のサンプル編 (3)
