Grafana という InfluxDB をバックエンドにしたグラフ描画ツールの存在を知ったので触ってみた。正確には、Grafana は本来は Graphite 用のダッシュボード置き換えツールなのだが、InfluxDB をバックエンドにしても動くらしい。というか、つい10日ほど前にサポートしたらしい。
InfluxDB については InfluxDB を10分だけ触ってみた の記事を参照。その記事の中で、Elasticsearch に対する Kibana のように、InfluxDB にも描画ツールがあれば便利だよね、という話をしたが、まさしく Grafana をその用途で使えるようだ。ちなみに、Grafana は Kibana を fork したツールである。
インストール
$ git clone git@github.com:torkelo/grafana.git
$ cd grafana/src
$ mv config.sample.js config.js
https://github.com/torkelo/grafana/wiki/InfluxDB のページを参考に config.js を以下の内容に置き換える。
InfluxDB を10分だけ触ってみたのようにして、test データベースは作ってあるものとする。
/** @scratch /configuration/config.js/1
 * == Configuration
 * config.js is where you will find the core Grafana configuration. This file contains parameter that
 * must be set before Grafana is run for the first time.
 */
define(['settings'],
function (Settings) {
  "use strict";
  return new Settings({
    elasticsearch: "http://"+window.location.hostname+":9200",
    datasources: {
      influx: {
        default: true,
        type: 'influxdb',
        url: "http://"+window.location.hostname+":8086/db/test",
        username: 'root',
        password: 'root',
      }
    },
    default_route: '/dashboard/file/default.json',
    timezoneOffset: null,
    grafana_index: "grafana-dash",
    panel_names: [
      'text',
      'graphite'
    ]
  });
});
ウェブサーバを立ち上げる
Kibana のセットアップをしたことがある人ならばわかると思うが、Grafana (Kibana) 自体は html および javascript だけなので、ウェブサーバを別途立てる必要がある。
ちょっと試したいだけなので、nginx とか立てずに以下のように ruby のワンライナーで立ち上げてみた。
$ ruby -rwebrick -e 'WEBrick::HTTPServer.new({:DocumentRoot => "./", :Port => 8080}).start'
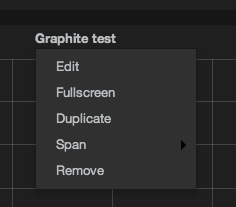
アクセス
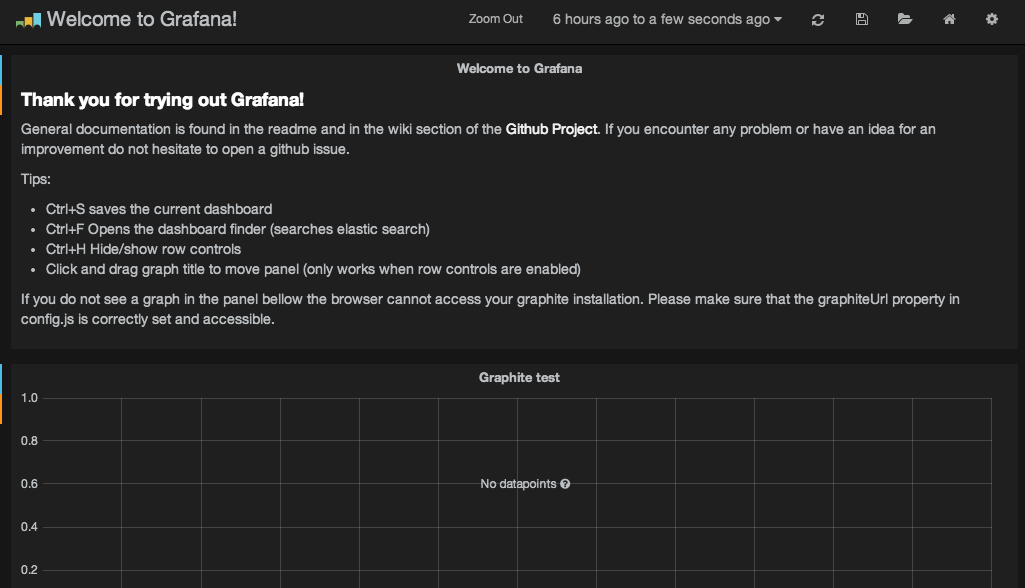
database 名 test をクリックするとドロップダウンが出てくるので Edit を選ぶ。※ Graphite じゃないのに、「Graphite」ってなってる... ^^;
クエリを入れられそうな画面がでてくるので、入れてみる
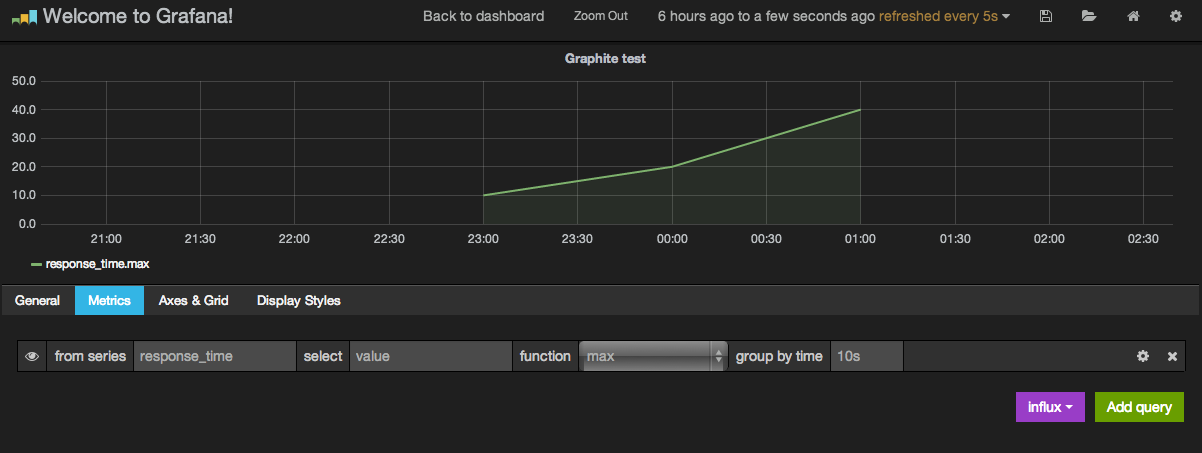
グラフ出た ^^
補足:なお、データは現在時間にあわせて InfluxDB の GUI から次のように投入した。time は miliseconds の epoch time なので注意。ruby で書くと Time.parse("2014-04-03 23:00:00 +0900").to_i * 1000 みたいな感じ。
Time Series Name: response_time
values: {"value":10,"time":1396533600000}
values: {"value":20,"time":1396537200000}
values: {"value":40,"time":1396540800000}
おわりに
Grafana は InfluxDB をサポートしはじめたばかりのようで、まだ細かい機能は今実装しているところの模様。
ダッシュボードの保存などの処理が kibana そのままで、どうやら elasticsearch が必要になるようだし、まだ発展途上感あるけど、期待したい。