ConvNet Drawer(2018/1/4追記)
以下のツールが公開されたため、こちらの使用を推奨します。
畳み込みニューラルネットワークをKeras風に定義するとアーキテクチャを図示してくれるツールを作った
KerasのSequentialモデルのような記法でモデルを定義すると、そのアーキテクチャを良い感じに図示してくれるツールを作りました。言ってしまえばテキストを出力しているだけのツールなので依存ライブラリとかもありません。
https://github.com/yu4u/convnet-drawer
概要
Python+pydot+Graphviz を使い、CNNアーキテクチャの図を描きます。
https://github.com/jettan/tikz_cnn を見て、似たような図をTeXではなくPythonで描きたいと思ったのが動機です。
準備
pydotplusとgraphvizをインストールします。
condaを使用していますが、pipでも大丈夫だと思います(未検証)。
conda install -c conda-forge pydotplus
conda install graphviz
適当なdotファイルを用意しておき、pydotplusで読み込み、画像保存・画像表示します。
(Jupyter上で画像表示しています。適宜編集して下さい。)
import pydotplus
from IPython.display import Image

graph = pydotplus.graphviz.graph_from_dot_file('dot/pytorchainer.dot')
graph.write_png('img/pytorchainer.png')
Image(graph.create_png())
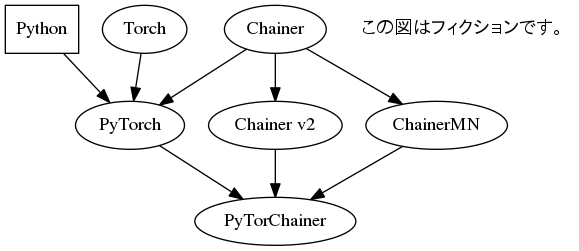
digraph G {

Python [shape=box]
Torch

Chainer -> "Chainer v2"
Chainer -> ChainerMN

Python -> PyTorch
Torch -> PyTorch
Chainer -> PyTorch

PyTorch -> PyTorChainer
"Chainer v2" -> PyTorChainer
ChainerMN -> PyTorChainer

この図はフィクションです。 [shape=plaintext]

}
これで、Pythonからdotファイルを描画する準備は完了です。
なお、dot言語やPyDotPlusの仕様は以下をご参照下さい。
Graphvizとdot言語でグラフを描く方法のまとめ
PyDotPlus API Reference
CNN描画
それでは、CNNアーキテクチャの図を描いていきます。と言っても、dot言語で書いたレイヤー(と矢印)をひたすら追加するだけです。以下、位置調整用のマジックナンバーが乱舞していますが、ご容赦下さい。
class CNNDot():
    def __init__(self):
        self.layer_id = 0
        self.arrow_id = 0

    def get_layer_str(self, size, channels, xoffset=0.0, yoffset=0.0, fillcolor='white', caption=''):
        width = size * 0.5
        height = size
        x = xoffset
        y = height * 0.5 + yoffset
        x_caption = x - width * 0.25
        y_caption = -y - 0.7

        layer_str = """
          layer{} [
              shape=polygon, sides=4, skew=-2, orientation=90,
              label="", style=filled, fixedsize=true, fillcolor="{}",
              width={}, height={}, pos="{},{}!"
          ]
        """.format(self.layer_id, fillcolor, width, height, x, y)

        if caption != '':
            layer_str += """
              layer_caption{} [
                  shape=plaintext, label="{}", fixedsize=true, fontsize=24,
                  pos="{},{}!"
              ]
            """.format(self.layer_id, caption, x_caption, y_caption)

        self.layer_id += 1
        return layer_str

    def get_arrow_str(self, xmin, ymin, xmax, ymax):
        arrow_str = """
            arrow{0}_tail [
                shape=none, label="", fixedsize=true, width=0, height=0,
                pos="{1},{2}!"
            ]
            arrow{0}_head [
                shape=none, label="", fixedsize=true, width=0, height=0,
                pos="{3},{4}!"
            ]
            arrow{0}_tail -> arrow{0}_head
        """.format(self.arrow_id, xmin, ymin, xmax, ymax)
        self.arrow_id += 1
        return arrow_str

cnndot = CNNDot()
# layers
graph_data_main = cnndot.get_layer_str(3.0, 0, -1.00, fillcolor='gray') # input
graph_data_main += cnndot.get_layer_str(3.0, 0, 0.00, caption='conv') # encoder begin
graph_data_main += cnndot.get_layer_str(3.0, 0, 0.50)
graph_data_main += cnndot.get_layer_str(2.5, 0, 1.25, caption='conv')
graph_data_main += cnndot.get_layer_str(2.5, 0, 1.75)
graph_data_main += cnndot.get_layer_str(2.0, 0, 2.50, caption='conv')
graph_data_main += cnndot.get_layer_str(2.0, 0, 3.00)
graph_data_main += cnndot.get_layer_str(1.5, 0, 3.75, caption='conv')
graph_data_main += cnndot.get_layer_str(1.5, 0, 4.25)
graph_data_main += cnndot.get_layer_str(1.0, 0, 5.00, caption='conv')
graph_data_main += cnndot.get_layer_str(1.0, 0, 5.50)
graph_data_main += cnndot.get_layer_str(1.0, 0, 6.25, caption='deconv') # decoder begin
graph_data_main += cnndot.get_layer_str(1.0, 0, 6.75)
graph_data_main += cnndot.get_layer_str(1.5, 0, 7.50, caption='deconv')
graph_data_main += cnndot.get_layer_str(1.5, 0, 8.00)
graph_data_main += cnndot.get_layer_str(2.0, 0, 8.75)
graph_data_main += cnndot.get_layer_str(2.0, 0, 9.25)
graph_data_main += cnndot.get_layer_str(2.5, 0, 10.00)
graph_data_main += cnndot.get_layer_str(2.5, 0, 10.50)
graph_data_main += cnndot.get_layer_str(3.0, 0, 11.25)
graph_data_main += cnndot.get_layer_str(3.0, 0, 11.75)
graph_data_main += cnndot.get_layer_str(3.0, 0, 12.75, fillcolor='#FF8080') # output

# arrows
graph_data_main += cnndot.get_arrow_str(0.50, 3.0*1.2, 11.25-0.22, 3.0*1.2)
graph_data_main += cnndot.get_arrow_str(1.75, 2.5*1.2, 10.00-0.20, 2.5*1.2)
graph_data_main += cnndot.get_arrow_str(3.00, 2.0*1.2, 8.75-0.18, 2.0*1.2)
graph_data_main += cnndot.get_arrow_str(4.25, 1.5*1.2, 7.50-0.16, 1.5*1.2)
graph_data_main += cnndot.get_arrow_str(5.50, 1.0*1.2, 6.25-0.14, 1.0*1.2)

graph_data_setting = 'graph[ layout = neato, size="16,8"]'
graph_data = 'digraph G {{ \n{}\n{}\n }}'.format(graph_data_setting, graph_data_main)
graph = pydotplus.graphviz.graph_from_dot_data(graph_data)

# save and show image
graph.write_png('img/encoder-decoder.png')
Image(graph.create_png())
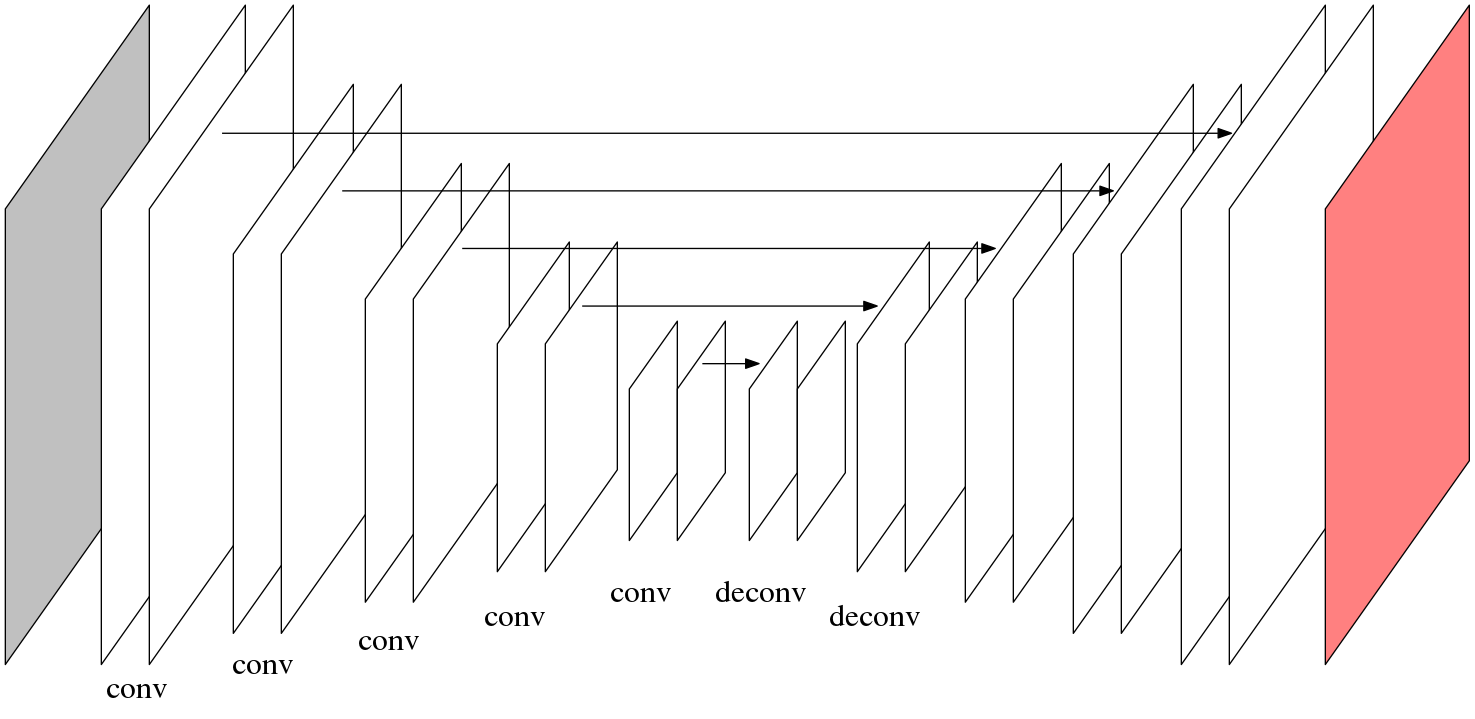
このコードの場合、以下のような図が表示されます。(各層が薄いのは仕様です。側面を張り込めば直方体も描ける筈。)
所感
- 今回のようなシンプルな図であれば良いが、dotで描画を凝るのは厳しいように感じる。
- フレームワークと連携して自動表示できると良い。
InceptionV3描画(2017/4/30追記)
上記のコードとは異なりますが、Kerasのモデル(InceptionV3)を描画してみました。
直方体はsvgwriteで描画して貼り付けています。
