概要
Graphvizはdot言語で記述されたグラフ構造を任意のフォーマットの画像ファイルへ出力するツールです。
グラフ構造はdot言語でdotファイルというプレーンテキストに記述します。
この記事はdot言語でグラフを書く方法を簡単にまとめたものです。
環境
下記の環境で動作確認を行いました。
- Windows7 (64bit)
- [Graphviz] (http://www.graphviz.org/) 2.38
参考
下記のサイトを参考にさせて頂きました。
- [Graphviz - Documentation] (http://www.graphviz.org/documentation/)
- [Graphviz - Gallery] (http://www.graphviz.org/gallery/)
- [Gvizの目次 - Rubyの世界からGraphvizの世界にこんにちは!] (http://melborne.github.io/2014/02/27/gviz-posts/)
- [Rank attribute is confusing to me - stackoverflow] (http://stackoverflow.com/questions/6149834/rank-attribute-is-confusing-to-me)
- [Basic Graphviz - GitHub] (https://gist.github.com/peterneubauer/2652082)
Graphviz チュートリアル (http://homepage3.nifty.com/kaku-chan/graphviz/index.html)
dot言語
dot言語では図形をノードと呼び、図形と図形の関連をエッジと呼びます。
ノードやエッジをどのような図形で表現するか、ラベルのフォントや色などをdot言語で記述します。
また同じdotファイルでも使用するレイアウトエンジンを変えることで異なる表現が可能です。
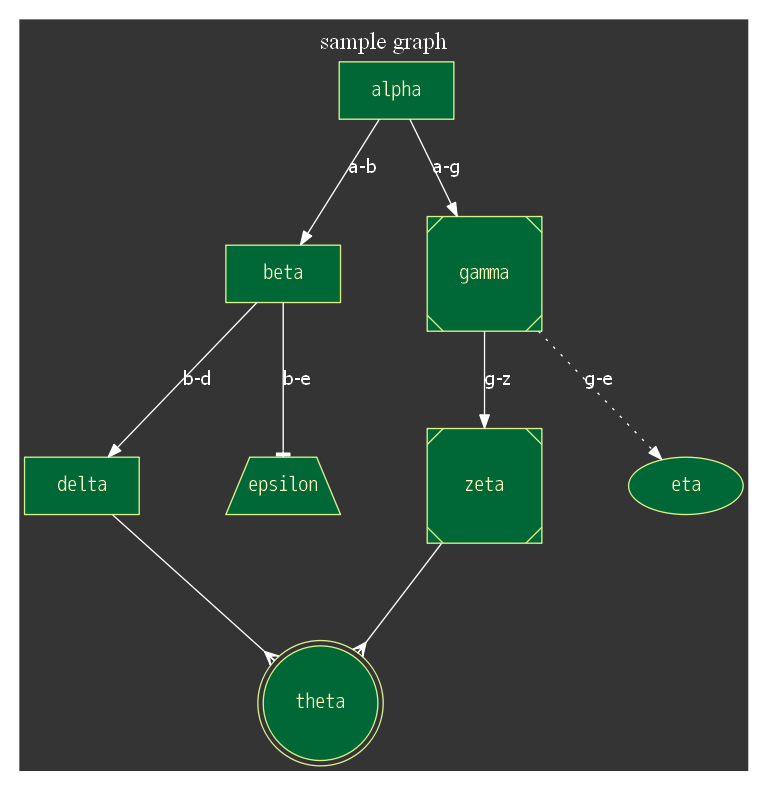
dot言語を使用すると下図ような図形を表現することができます。
この図は下記のdotファイルより生成しました。
digraph graph_name {
  graph [
    charset = "UTF-8";
    label = "sample graph",
    labelloc = "t",
    labeljust = "c",
    bgcolor = "#343434",
    fontcolor = white,
    fontsize = 18,
    style = "filled",
    rankdir = TB,
    margin = 0.2,
    splines = spline,
    ranksep = 1.0,
    nodesep = 0.9
  ];

  node [
    colorscheme = "rdylgn11"
    style = "solid,filled",
    fontsize = 16,
    fontcolor = 6,
    fontname = "Migu 1M",
    color = 7,
    fillcolor = 11,
    fixedsize = true,
    height = 0.6,
    width = 1.2
  ];

  edge [
    style = solid,
    fontsize = 14,
    fontcolor = white,
    fontname = "Migu 1M",
    color = white,
    labelfloat = true,
    labeldistance = 2.5,
    labelangle = 70
  ];

  // node define
  alpha [shape = box];
  beta [shape = box];
  gamma [shape = Msquare];
  delta [shape = box];
  epsilon [shape = trapezium];
  zeta [shape = Msquare];
  eta;
  theta [shape = doublecircle];

  // edge define
  alpha -> beta [label = "a-b", arrowhead = normal];
  alpha -> gamma [label = "a-g"];
  beta -> delta [label = "b-d"];
  beta -> epsilon [label = "b-e", arrowhead = tee];
  gamma -> zeta [label = "g-z"];
  gamma -> eta [label = "g-e", style = dotted];
  delta -> theta [arrowhead = crow];
  zeta -> theta [arrowhead = crow];
}
dotファイルの基本的な構造
// dotファイルはdigraphまたはgraphで始めます
// graph_nameはこの例でのグラフ名です。
digraph graph_name {

  //graph settings
  graph [
    // graphは予約語です。
    // ここにグラフ全体の設定を行います。
  ];

  // node common setting
  node [
    // nodeは予約語です。
    // ここで設定した属性はすべてのノードに反映されます。
    // ノードの共通の設定はここに記述します。
  ];

  // edge common setting
  edge [
    // edgeは予約語です。
    // ここで設定した属性はすべてのエッジに反映されます。
    // エッジの共通の設定はここに記述します。
  ];

  // define alpha node
  alpha [
    // alphaという名前はこの例で付けたノード名です。任意の名前を付けることができます。
    // ここにalphaノード固有の属性を設定します。
  ];

  // define beta node
  beta [
    // betaという名前はこの例で付けたノード名です。任意の名前を付けることができます。
    // ここにbetaノード固有の属性を設定します。
  ];

  // define gamma and delta, epsilon node
  gamma, delta, epsilon [
    // 複数のノードに同じ属性を設定したい場合はカンマで区切って定義します。
    // ここにgamma,delta, epsilonノードの属性を設定します。
  ];

  // define alpha-beta edge
  alpha -> beta [
    // ここにalphaからbetaのエッジ固有の属性を設定します。
  ];

  // define gamma-delta-epsilon edge
  gamma -> delta -> epsilon [
    // 複数のノードを繋げることで連続してエッジを定義することができます。
  ];

  // define subgraph
  subgraph cluster_sub1 [
     // ここにサブグラフの属性を設定します。
  ];

}
- digraph : グラフの種類です。(digraph=有向グラフ、graph=無向グラフ)
- graph_name : グラフの名前です。任意の名前をつけることが出来ます。
- graph : グラフの属性値を設定します。
- node : ここで設定する属性値は全てのノードに適用されます。
- edge : ここで設定する属性値は全てのエッジに適用されます。
グラフの定義
グラフの定義と属性の設定は下記のようにgraphという名前の[ ]内に属性と値を記述することで行います。
digraph graph_name {

  graph [
    属性 = 値,
    属性 = 値,
    ...
  ];

}
layout
layout属性でレイアウトエンジンを指定することができます。
同じdotファイルでもlayoutを変えることによってさまざまなグラフを生成することができます。
| layout | description |
|---|---|
| circo | 円形のグラフ. |
| dot | 階層型のグラフ. 有向グラフ向き. デフォルトのレイアウトエンジン |
| fdp | スプリング(ばね)モデルのグラフ. 無向グラフ向き. |
| neato | スプリング(ばね)モデルのグラフ. 無向グラフ向き. |
| osage | 配列型のグラフ. |
| sfdp | fdpのマルチスケール版. 大きな無向グラフ向き. |
| twopi | 放射型のグラフ. ノードは同心円状に配置される. |
digraph graph_name {
  graph [
    charset = "UTF-8";
    labelloc = "t",
    labeljust = "c",
    bgcolor = "#343434",
    fontcolor = white,
    fontsize = 18,
    style = "filled",
    rankdir = TB,
    margin = 0.2,
    layout = circo
//    layout = dot
//    layout = fdp
//    layout = neato
//    layout = osage
//    layout = sfdp
//    layout = twopi
  ];
  node [
    colorscheme = "rdylgn11"
    style = "solid,filled",
    fontsize = 14,
    fontcolor = 6,
    fontname = "Migu 1M",
    color = 7,
    fillcolor = 11
  ];
  edge [
    color = white
  ];

  alpha, beta, gamma , delta, epsilon, zeta, eta, theta;
  alpha -> beta;
  alpha -> gamma;
  alpha -> delta;
  alpha -> epsilon;
  alpha -> zeta;
  alpha -> eta;
  alpha -> theta;
  iota, kappa, lambda, mu, nu, xi;
  beta -> iota;
  beta -> kappa;
  gamma -> lambda;
  gamma -> mu;
  gamma -> nu;
  gamma -> xi;
  omicron, pi, rho;
  delta -> omicron;
  delta -> pi;
  delta -> rho;
  sigma, tau;
  epsilon -> sigma;
  epsilon -> tau;
}
このグラフは上記のdotファイルより生成しました。
| layout | graph |
|---|---|
| circo | 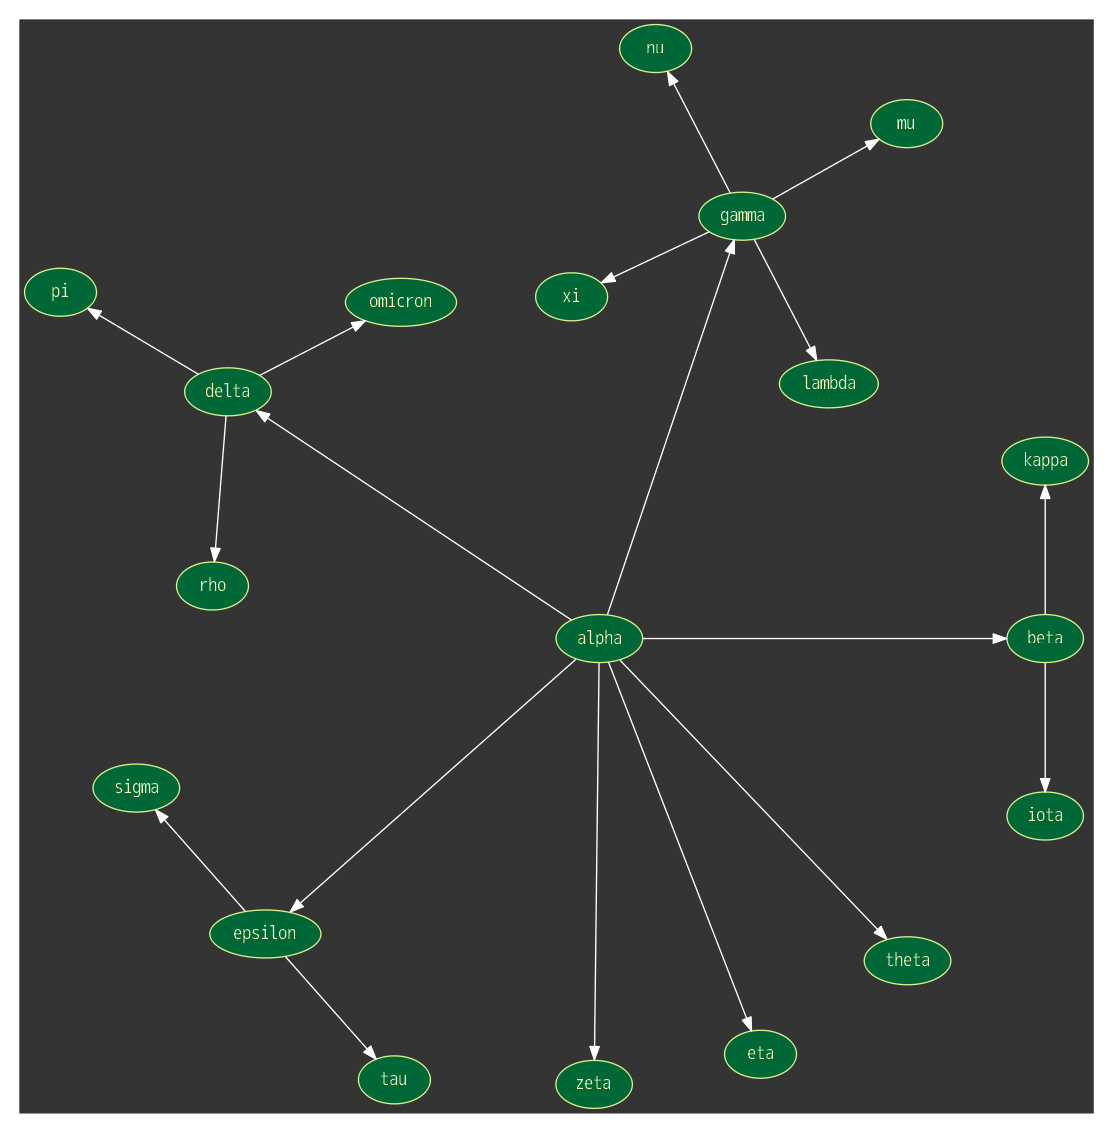 |
| dot |  |
| fdp | 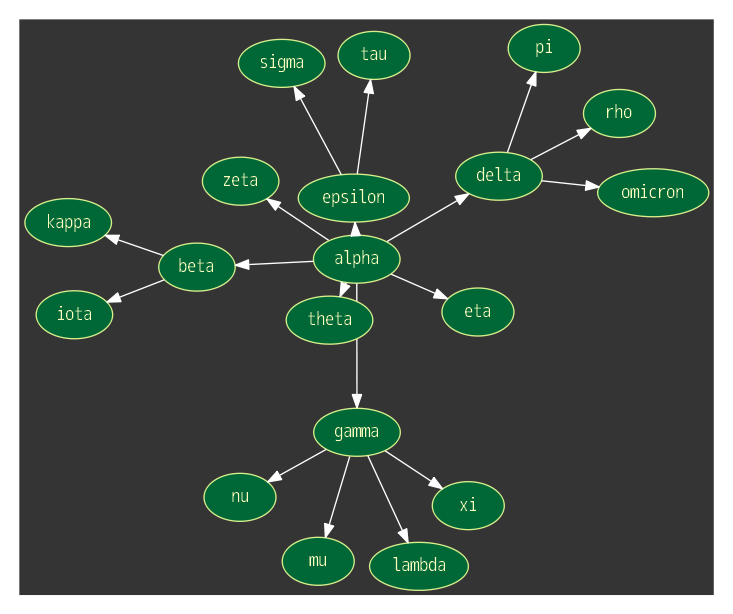 |
| neato | 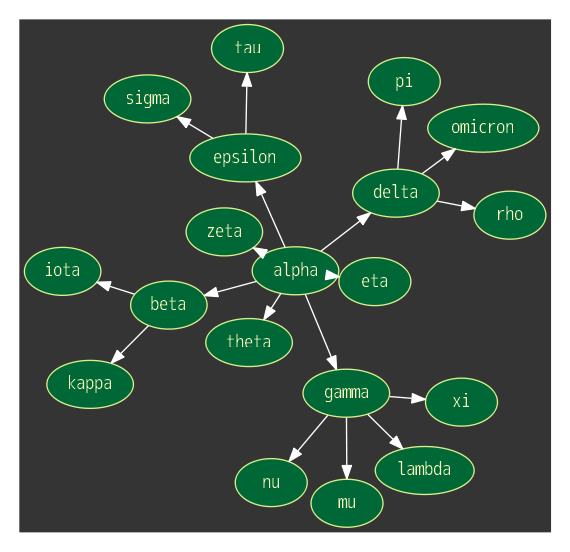 |
| osage | 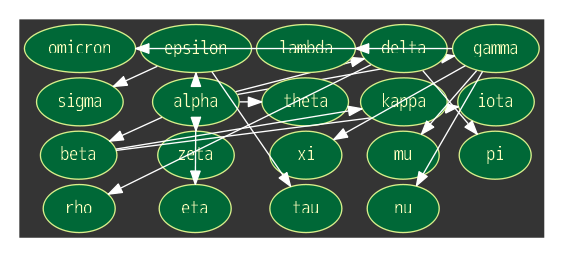 |
| sfdp | 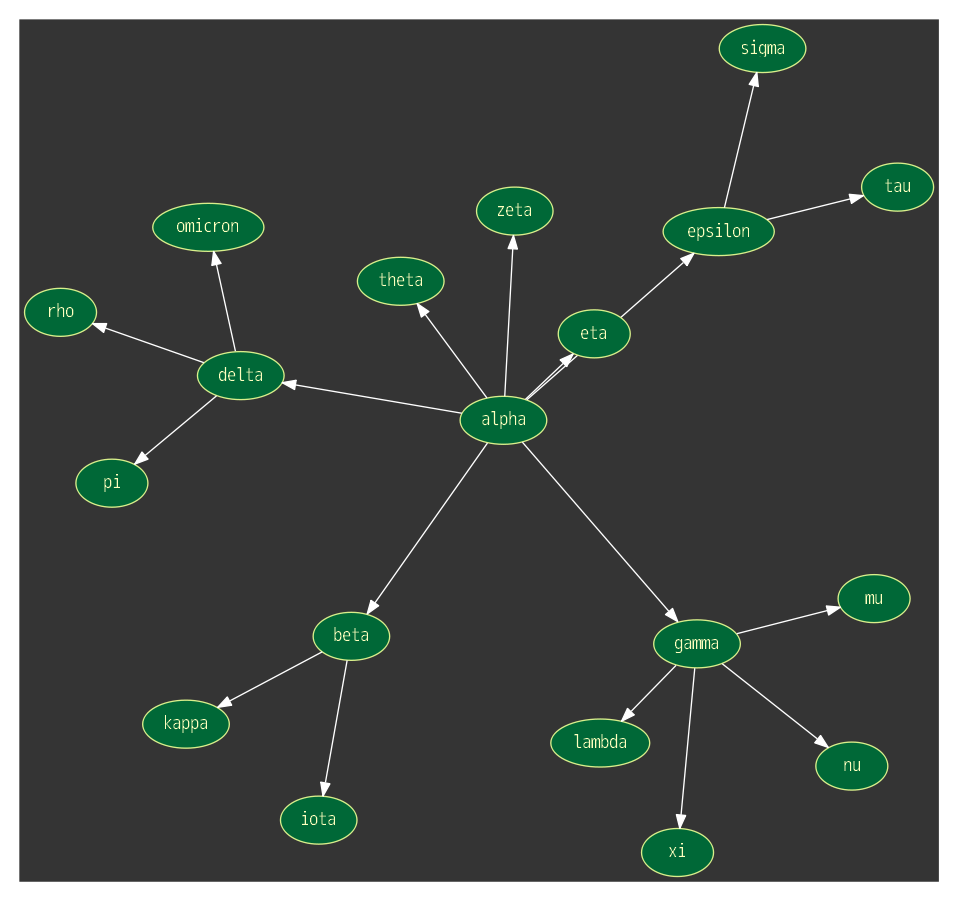 |
| twopi | 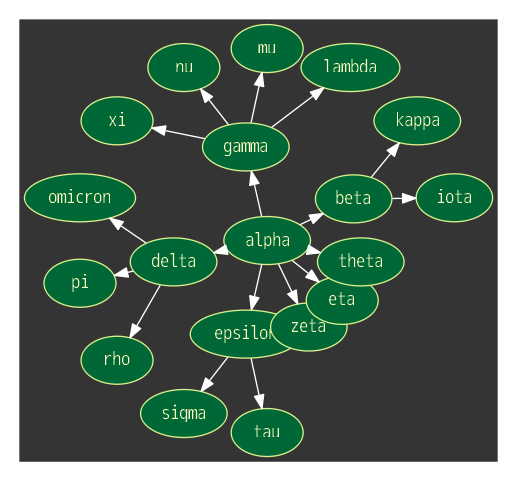 |
ノードの定義
もっとも簡単なノードの定義は下記のようにノード名を記述するだけです。
digraph graph_name {
  alpha;
  beta;
}
ノードの属性の設定は下記のようにノード名の後の[ ]内に属性と値を記述することで行います。
ノード名 [
  属性 = 値,
  属性 = 値,
  ...
];
主なノードの属性は下記のものがあります。
digraph graph_name {
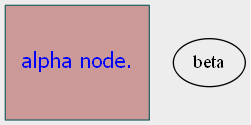
  alpha [
    label = "alpha node.",    //ノードラベル
    shape = box,              //ノードの形を指定する
    fixedsize = true,         //ノードの大きさを指定可能とする
    width = 1.5,              //ノードの幅(インチ)
    height = 1.2,             //ノードの高さ(インチ)
    style = "solid,filled"    //ノードの枠線のスタイルと塗つぶしの指定
    color = "#336666",        //ノードの枠線の色
    fillcolor = "#CC9999",    //ノードを塗りつぶす色
    fontname = "Migu 1M",     //ノードラベルフォント
    fontsize = 16,            //ノードラベルフォントサイズ
    fontcolor = blue          //ノードラベルフォントカラー
  ];
  beta;
}
エッジの定義
エッジの定義は任意の2つのノードを->で繋げる事で行います。
digraph graph_name {
  alpha;
  beta;
  alpha -> beta;
}
また、複数のエッジをまとめて定義することができます。
この例ではdeltaノードは定義されていませんが、ノードが存在しない場合はノードの定義も同時に行われます。
digraph graph_name {
  alpha;
  beta;
  alpha -> beta -> delta;
}
エッジの属性の設定は下記のようにエッジの定義の後の[ ]内に属性と値を記述することで行います。
ノード名1 -> ノード名2 [
  属性 = 値,
  属性 = 値,
  ...
];
主なエッジの属性は下記のものがあります。
digraph graph_name {
  graph [
    ranksep = 1.1
  ];

  //node define
  alpha;
  beta;

  // edge define
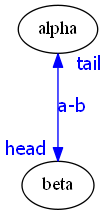
  alpha -> beta [
    label = "a-b",            //エッジラベル
    labelfloat = true,        //ラベルの重なりを許可する
    headlabel = "head",       //エッジの終端にラベルをつける
    taillabel = "tail",       //エッジの始端にラベルをつける
    labeldistance = 2.5,      //ラベルの位置をノードからの距離で指定する
    labelangle = 70,          //ラベルの位置を角度で指定する
    color = blue,             //エッジカラー
    style = solid,            //エッジスタイル
    dir = both,               //エッジの矢印を指定する
    arrowhead = normal,       //エッジの終端の形状を指定
    arrowtail = normal,       //エッジの始端の形状を指定
    arrowsize = 1,            //矢印の大きさ倍率で指定
    weight = 5                //エッジの重み付け 重みが大きいエッジが結ぶノードがより近く配置される
    fontname = "Migu 1M",     //エッジラベルフォント
    fontsize = 14,            //エッジラベルフォントサイズ
    fontcolor = blue          //エッジラベルフォントカラー
  ];
}
下記のように複数のエッジの属性をまとめて設定することも可能です。
digraph graph_name {
  graph [rankdir = LR];
  node [shape = none];

  1 -> 2 -> 3 -> 4 [
    arrowhead = none
  ];
}
node
Node Shapes
主なノードの形状の種類は下記の通りです。(これで全てでは有りません。)
| name | desc |
|---|---|
| box | 箱形 |
| polygon | 多角形 |
| ellipse (default) | 楕円 |
| oval | 卵型 |
| circle | 円 |
| point | 点 |
| egg | 卵 |
| triangle | 三角形 |
| plaintext | テキスト |
| plain | テキスト |
| diamond | ダイヤモンド |
| trapezium | 台形 |
| parallelogram | 平行四辺形 |
| house | 家 |
| pentagon | 五角形 |
| hexagon | 六角形 |
| septagon | 七角形 |
| octagon | 八角形 |
| doublecircle | 二重線の丸 |
| doubleoctagon | 二重線の八角形 |
| tripleoctagon | 三重線の八角形 |
| invtriangle | 逆三角形 |
| invtrapezium | 逆台形 |
| invhouse | 逆さの家 |
| Mdiamond | ダイヤモンド |
| Msquare | 正方形 |
| Mcircle | 円 |
| rect | 長方形. boxのシノニム. |
| rectangle | 長方形. boxのシノニム. |
| square | 正方形 |
| star | 星 |
| none | 無し. plaintextのシノニム. |
| underline | 下線 |
| note | ノート |
| tab | タブ |
| folder | フォルダー |
| box3d | 3Dの箱形 |
| rarrow | 右向きの矢印 |
| larrow | 左向きの矢印 |
polygon
ポリゴンは他の形状とは少し設定する属性が増えます。
- sides : 辺の数を指定します。デフォルトは4です。
- skew : 正数は上部が右方向へゆがみます。負数は左方向へ歪みます。
- distortion : 正数は上部の辺の長さが下部よりも大きくなるようにします。負数は逆の結果になります。
Node Shape Sample
サンプル1
digraph shape_sample01 {
  graph [
    charset = "UTF-8";
    labelloc = "t",
    labeljust = "c",
    bgcolor = "#343434",
    fontcolor = white,
    fontsize = 18,
    style = "filled",
    rankdir = TB,
    margin = 0.2
  ];
  node [
    colorscheme = "rdylgn11"
    style = "solid,filled",
    fontsize = 18,
    fontcolor = 6,
    fontname = "Migu 1M",
    color = 7,
    fillcolor = 11
  ];

  // node define
  shape1 [label = "box", shape = box];
  shape2 [ label = "polygon", shape = polygon,
    sides = 8,
    skew = 0.0,
    distortion = 0.0
  ];
  shape3 [label = "ellipse", shape = ellipse];
  shape4 [label = "oval", shape = oval];
  shape5 [label = "circle",shape = circle];
  shape6 [label = "point", shape = point];
  shape7 [label = "egg", shape = egg];
}
サンプル2
digraph shape_sample02 {
  graph [
    charset = "UTF-8";
    labelloc = "t",
    labeljust = "c",
    bgcolor = "#343434",
    fontcolor = white,
    fontsize = 18,
    style = "filled",
    rankdir = TB,
    margin = 0.2
  ];
  node [
    colorscheme = "rdylgn11"
    style = "solid,filled",
    fontsize = 18,
    fontcolor = 6,
    fontname = "Migu 1M",
    color = 7,
    fillcolor = 11
  ];

  // node define
  shape1 [label = "triangle", shape = triangle];
  shape2 [label = "plaintext", shape = plaintext];
  shape3 [label = "plain", shape = plain];
  shape4 [label = "diamond", shape = diamond];
  shape5 [label = "trapezium", shape = trapezium];
  shape6 [label = "parallelogram", shape = parallelogram];
  shape7 [label = "house", shape = house];
}
サンプル3
digraph shape_sample03 {
  graph [
    charset = "UTF-8";
    labelloc = "t",
    labeljust = "c",
    bgcolor = "#343434",
    fontcolor = white,
    fontsize = 18,
    style = "filled",
    rankdir = TB,
    margin = 0.2
  ];
  node [
    colorscheme = "rdylgn11"
    style = "solid,filled",
    fontsize = 18,
    fontcolor = 6,
    fontname = "Migu 1M",
    color = 7,
    fillcolor = 11
  ];

  // node define
  shape1 [label = "pentagon", shape = pentagon];
  shape2 [label = "hexagon", shape = hexagon];
  shape3 [label = "septagon", shape = septagon];
  shape4 [label = "octagon", shape = octagon];
  shape5 [label = "doublecircle", shape = doublecircle];
  shape6 [label = "doubleoctagon", shape = doubleoctagon];
  shape7 [label = "tripleoctagon", shape = tripleoctagon];
}
サンプル4
digraph shape_sample04 {
  graph [
    charset = "UTF-8";
    labelloc = "t",
    labeljust = "c",
    bgcolor = "#343434",
    fontcolor = white,
    fontsize = 18,
    style = "filled",
    rankdir = TB,
    margin = 0.2
  ];
  node [
    colorscheme = "rdylgn11"
    style = "solid,filled",
    fontsize = 18,
    fontcolor = 6,
    fontname = "Migu 1M",
    color = 7,
    fillcolor = 11
  ];

  // node define
  shape1 [label = "invtriangle", shape = invtriangle];
  shape2 [label = "invtrapezium", shape = invtrapezium];
  shape3 [label = "invhouse", shape = invhouse];
  shape4 [label = "Mdiamond", shape = Mdiamond];
  shape5 [label = "Msquare", shape = Msquare];
  shape6 [label = "Mcircle", shape = Mcircle];
  shape7 [label = "square", shape = square];
}
サンプル5
digraph shape_sample05 {
  graph [
    charset = "UTF-8";
    labelloc = "t",
    labeljust = "c",
    bgcolor = "#343434",
    fontcolor = white,
    fontsize = 18,
    style = "filled",
    rankdir = TB,
    margin = 0.2
  ];
  node [
    colorscheme = "rdylgn11"
    style = "solid,filled",
    fontsize = 18,
    fontcolor = 6,
    fontname = "Migu 1M",
    color = 7,
    fillcolor = 11
  ];

  // node define
  shape1 [label = "star", shape = star];
  shape2 [label = "underline", shape = underline];
  shape3 [label = "note", shape = note];
  shape4 [label = "tab", shape = tab];
  shape5 [label = "folder", shape = folder];
  shape6 [label = "box3d", shape = box3d];
  shape7 [label = "rarrow", shape = rarrow];
  shape8 [label = "larrow", shape = larrow];
}
Node Sytle
sytle属性でノードのスタイルを設定します。
下記はノードのスタイル(枠線、塗つぶし方法)の種類です。
| name | desc |
|---|---|
| solid | 枠を実線で引く |
| dashed | 枠を破線で引く |
| dotted | 枠を点線で引く |
| bold | 枠を太線で引く |
| rounded | 枠を角丸で引く |
| diagonals | |
| filled | ノードを単色で塗つぶし |
| striped | ノードを複数色で縦縞状に塗つぶし |
| wedged | ノードを複数色で楔状に塗つぶし |
striped
The style "striped" is only supported with clusters and rectangularly-shaped nodes.
- box
- Msquare
- rect
- rectangle
- square
wedged
The style "wedged" is allowed only for elliptically-shaped nodes.
- ellipse
- oval
- circle
- doublecircle
- Mcircle
サンプル
digraph node_sample {
  //graph settings
  graph [
    charset = "UTF-8";
    label = "node simple",
    labelloc = "t",
    labeljust = "c",
    bgcolor = "#343434",
    fontcolor = white,
    fontsize = 18,
    style = "filled",
    rankdir = TB,
    margin = 0.2
  ];
  // node common settings
  node [
    colorscheme = rdylgn11,
    fontname = "Migu 1M",
    color = 7,
    fontsize = 18,
    fontcolor = 6,
    fillcolor = 11,
    margin = 0.2
  ];

  // node define
  alpha [shape = box, label = "alpha", style = "solid,filled"];
  beta [shape = box, label = "beta", style = "dashed,filled"];
  gamma [shape = box, label = "gamma", style = "dotted,filled"];
  delta [shape = box, label = "delta", style = "bold,filled"];
  epsilon [shape = box, label = "epsilon", style = "rounded,filled"];
  zeta [shape = box, label = "zeta", style = "diagonals,filled"];
  eta [shape = box, label = "eta", style = "solid,striped" fillcolor = "8:9:10:11"];
  theta [shape = ellipse, label = "theta", style = "solid,wedged", fillcolor = "8:9:10:11"];
}
レコード
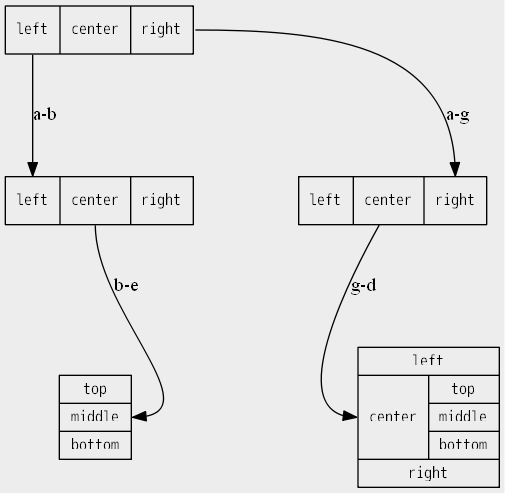
ノードにはrecordという他の図形とは少し扱い方が異なる図形があります。
ラベルを|で区切るとノードをセルに分割することができます。
またラベルを{ }で囲むとセルの描画方向が横から縦に変わり、{ }をネストさせる度にセルの描画方向が横→縦→横のように変わります。
digraph graph_name {
  graph [
    charset = "UTF-8",
    bgcolor = "#EDEDED",
    rankdir = TB,
    nodesep = 1.1,
    ranksep = 1.05
  ];

  node [
    shape = record,
    fontname = "Migu 1M",
    fontsize = 12,
  ];

  // node define
  alpha [label = "<pl>left|center|<pr>right"];
  beta [label = "<pl>left|<pc>center|<pr>right"];
  gamma [label = "left|center|<pr>right"];
  delta [label = "{left|{<pc>center|{top|middle|bottom}}|right}}"];
  epsilon [label = "{top|<pm>middle|bottom}"];

  // edge define
  alpha:pl -> beta:pl [ label = "a-b", weight = 2.0];
  alpha:pr -> gamma:pr [label = "a-g", weight = 1.0];
  beta:pc -> epsilon:pm [label = "b-e"];
  gamma -> delta:pc [label = "g-d"];
}
エッジをどのラベルから出すかポート名を指定して決めることができます。
ポート名はラベル中に<ポート名>のように記述します。
label = "left|center|<pr>right"
エッジを定義する際にノード名の後に:で区切ってポート名を指定します。
ノード名:ポート名 -> ノード名:ポート名 [
  ...
];
ノードのランク
rank
rank属性でノードのランクを設定します。
最小ランクが一番上または一番左に配置され、最大ランクが一番下または一番右に配置されます。
- same : ノードを同じランクに配置します。
- min : ノードを最小ランクに配置します。
- source : (通常は)ノードを最小ランクに配置します。
- max : ノードを最大ランクに配置します。
- sink : maxと同じようにノードを一番下または一番左に配置します。
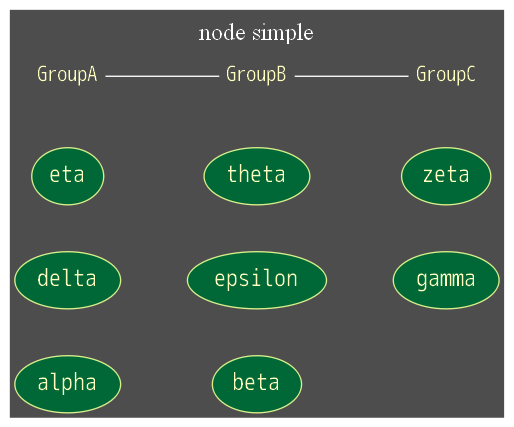
この例では下記のようにランク付けを行っています。
- GroupAノードとalpha, delta, etaノードが同じランクになる
- GroupBノードとbeta, epsilon, thetaノードが同じランクになる
- GroupCノードとgamma, zetaノードが同じランクになる
digraph graph_name {
  graph [
    charset = "UTF-8";
    label = "node simple",
    labelloc = "t",
    labeljust = "c",
    bgcolor = "#4D4D4D",
    fontcolor = white,
    fontsize = 18,
    style = "filled",
    rankdir = LR,
    margin = 0.1,
    nodesep = 0.5,
    ranksep = 0.7
  ];
  node [
    shape = ellipse,
    style = "filled",
    colorscheme = rdylgn11,
    fontname = "Migu 1M",
    color = 7,
    fontsize = 18,
    fontcolor = 6,
    fillcolor = 11,
    margin = 0.07
  ];
  edge [
    colorscheme = rdylgn11,
    color = 7
  ]

  alpha, beta, gamma, delta, epsilon, zeta, eta, theta;

  GroupA, GroupB, GroupC [shape = none, style = "", fontsize = 16];

  GroupA -> GroupB -> GroupC [arrowhead = none, color = white];

  {rank = same; GroupA; alpha; delta; eta;}
  {rank = same; GroupB; beta; epsilon; theta;}
  {rank = same; GroupC; gamma; zeta;}

}
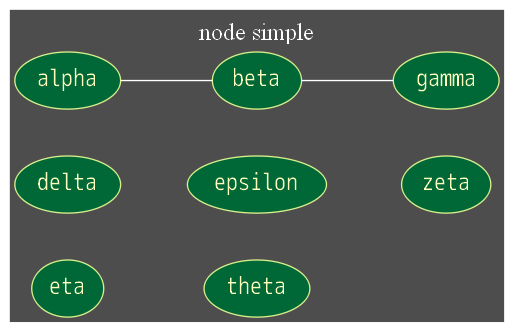
任意のノードを最小ランクや最大ランクにまとめるには下記のように記述します。
グラフは左側から右側へ描画する設定(rankdir = LR)になっているので、最小ランクのノードは左側、最大ランクのノードは右側に配置されます。
digraph graph_name {
  graph [
    charset = "UTF-8";
    label = "node simple",
    labelloc = "t",
    labeljust = "c",
    bgcolor = "#4D4D4D",
    fontcolor = white,
    fontsize = 18,
    style = "filled",
    rankdir = LR,
    margin = 0.1,
    nodesep = 0.5,
    ranksep = 0.7
  ];
  node [
    shape = ellipse,
    style = "filled",
    colorscheme = rdylgn11,
    fontname = "Migu 1M",
    color = 7,
    fontsize = 18,
    fontcolor = 6,
    fillcolor = 11,
    margin = 0.07
  ];
  edge [
    colorscheme = rdylgn11,
    color = 7
  ]

  theta, eta, zeta, epsilon, delta, gamma, beta, alpha;

  alpha -> beta -> gamma [arrowhead = none,  color = white];

  {rank = min; alpha; delta; eta;}
  {rank = same; beta; epsilon; theta;}
  {rank = max; gamma; zeta;}

}
サンプル
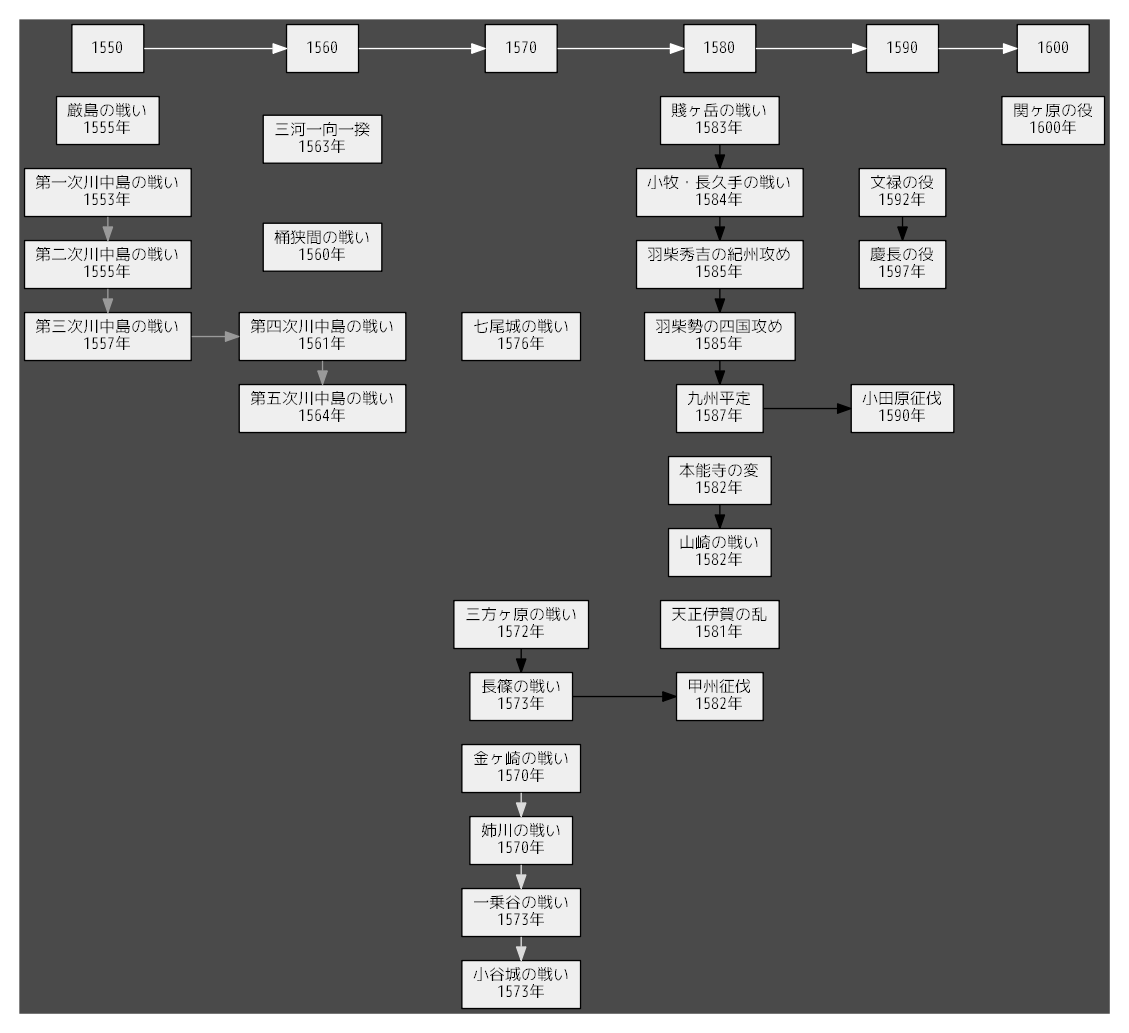
rankを使って年表を表現したサンプルです。
digraph graph_name {
  graph [
    charset = "UTF-8",
    bgcolor = "#4A4A4A",
    rankdir = LR,
    margin = 0.2
  ];
  node [
    shape = box,
    fontname = "Migu 1M",
    fontsize = 12,
    style = "solid, filled",
    fillcolor = "#EFEFEF"
  ];

   b1 [label = "第一次川中島の戦い\n1553年"];
   b2 [label = "第二次川中島の戦い\n1555年"];
   b3 [label = "厳島の戦い\n1555年"];
   b4 [label = "第三次川中島の戦い\n1557年"];

   b5 [label = "桶狭間の戦い\n1560年"];
   b6 [label = "第四次川中島の戦い\n1561年"];
   b7 [label = "三河一向一揆\n1563年"];
   b8 [label = "第五次川中島の戦い\n1564年"];

   b9 [label = "金ヶ崎の戦い\n1570年"];
   b10 [label = "姉川の戦い\n1570年"];
   b14 [label = "三方ヶ原の戦い\n1572年"];
   b15 [label = "一乗谷の戦い\n1573年"];
   b16 [label = "小谷城の戦い\n1573年"];
   b17 [label = "長篠の戦い\n1573年"];
   b18 [label = "七尾城の戦い\n1576年"];

   b20 [label = "天正伊賀の乱\n1581年"];
   b21 [label = "甲州征伐\n1582年"];
   b22 [label = "本能寺の変\n1582年"];
   b23 [label = "山崎の戦い\n1582年"];
   b24 [label = "賤ヶ岳の戦い\n1583年"];
   b25 [label = "小牧・長久手の戦い\n1584年"];
   b27 [label = "羽柴秀吉の紀州攻め\n1585年"];
   b28 [label = "羽柴勢の四国攻め\n1585年"];
   b29 [label = "九州平定\n1587年"];

   b30 [label = "小田原征伐\n1590年"];
   b31 [label = "文禄の役\n1592年"];
   b32 [label = "慶長の役\n1597年"];

   b33 [label = "関ヶ原の役\n1600年"];

   b1 -> b2 -> b4 -> b6 -> b8 [color = "#9A9A9A"];
   b9 -> b10 -> b15 -> b16 [color = "#DBDBDB"];
   b14 -> b17 -> b21;
   b22 -> b23;
   b24 -> b25 ->  b27 -> b28 -> b29 -> b30;
   b31 -> b32;

  1550, 1560, 1570, 1580, 1590, 1600;
  1550 -> 1560 -> 1570 -> 1580 -> 1590 -> 1600 [arrowhead = normal,  color = white];

   {rank = same; 1550; b1; b2; b3; b4;}
   {rank = same; 1560; b5; b6; b7; b8;}
   {rank = same; 1570; b9; b10; b14; b15; b16; b17; b18;}
   {rank = same; 1580; b20; b21; b22; b23; b24; b25; b27; b28; b29;}
   {rank = same; 1590; b30; b31; b32;}
   {rank = same; 1600; b33;}
}
サブグラフの定義
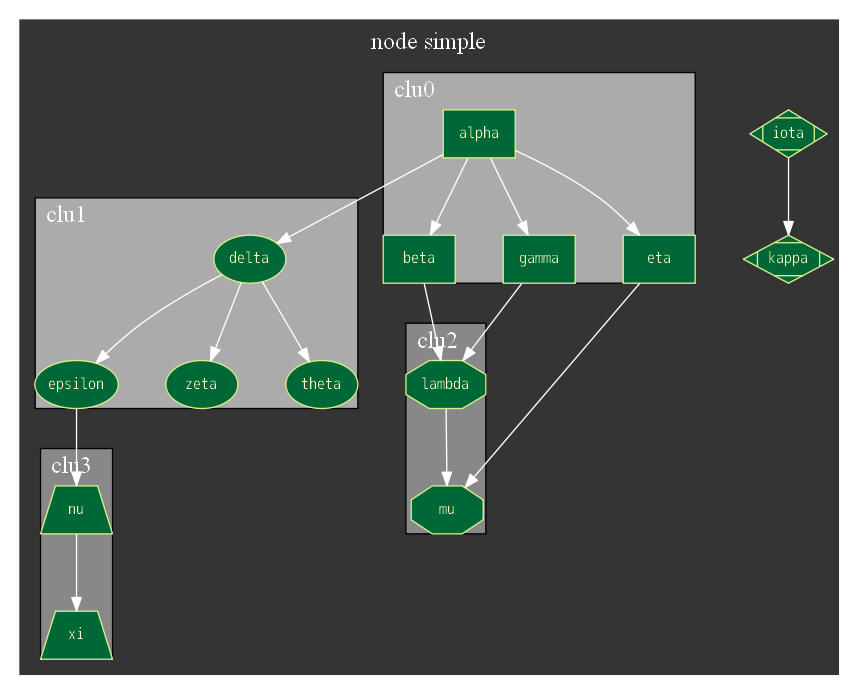
サブグラフの定義は下記のようにsubgraphというキーワードの後にclusterという文字からはじまる名前を付けます。(clusterという名前を付けるとクラスターサブグラフとして扱われます。)
属性はグラフと同様に[ ]内に属性と値を記述することで行います。
digraph graph_name {

  // define subgraph
  subgraph cluster_sub1 [
    属性 = 値;
    属性 = 値;
    ...
  ];

}
サンプル
digraph node_sample {
  //graph settings
  graph [
    charset = "UTF-8";
    label = "node simple",
    labelloc = "t",
    labeljust = "c",
    bgcolor = "#343434",
    fontcolor = white,
    fontsize = 18,
    style = "filled",
    rankdir = TB,
    margin = 0.2,
    nodesep = 0.5,
    ranksep = 0.8,
    compound = true
  ];
  // node common settings
  node [
    colorscheme = rdylgn11,
    fontname = "Migu 1M",
    color = 7,
    fontsize = 12,
    fontcolor = 6,
    fillcolor = 11,
    margin = 0.05,
    style = "solid,filled"
  ];
  edge [
    color = white
  ];

  subgraph cluster_0 {
    label = "clu0";
    labelloc = "t";
    labeljust = "l";
    fillcolor = "#ababab";

    alpha [label = "alpha", shape = box];
    beta [label = "beta", shape = box];
    gamma [label = "gamma", shape = box];
    eta [label = "eta", shape = box];

    alpha -> beta;
    alpha -> gamma;
    alpha -> eta;
  };

  subgraph cluster_1 {
    label = "clu1";
    labelloc = "t";
    labeljust = "l";
    fillcolor = "#ababab";

    delta [label = "delta"];
    epsilon [label = "epsilon"];
    zeta [label = "zeta"];
    theta [label = "theta"];

    delta -> epsilon;
    delta -> zeta;
    delta -> theta;
  };

  subgraph cluster_2 {
    label = "clu2";
    labelloc = "t";
    labeljust = "l";
    fillcolor = "#888888";

    lambda [label = "lambda", shape = "octagon"];
    mu [label = "mu", shape = "octagon"];

    lambda -> mu;
  };

 subgraph cluster_3 {
    label = "clu3";
    labelloc = "t";
    labeljust = "l";
    fillcolor = "#888888";

    nu [label = "nu", shape = "trapezium"];
    xi [label = "xi", shape = "trapezium"];

    nu -> xi;
  }

  subgraph sg {
    iota [label = "iota", shape = "Mdiamond" ];
    kappa [label = "kappa", shape = "Mdiamond"];
    iota -> kappa;
  };

  alpha -> delta;
  beta -> lambda [weight = 3];
  gamma -> lambda;
  epsilon -> nu;
  eta -> mu;
}
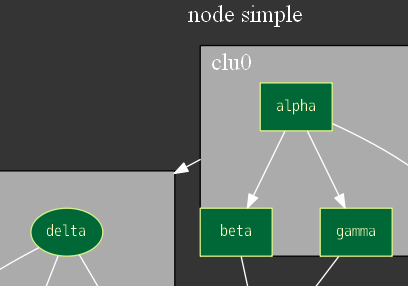
compound
compound属性は2つのクラスターサブグラフ間にまたがるノードのエッジの始端、終端の位置をクラスターサブグラフの外縁に設定できるようにします。
エッジの両端をどのクラスターサブグラフにクリップするかはlhead属性とltail属性で指定します。
graph [
  compound = true
];

alpha -> delta [lhead = "cluster_1", ltail = "cluster_0"];
edge
edge Sytle
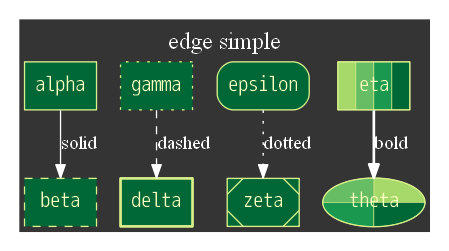
style属性でエッジのスタイルを設定できます。
下記はエッジのスタイルの種類です。
| name | desc |
|---|---|
| solid | エッジを実線で引く |
| dashed | エッジを破線で引く |
| dotted | エッジを点線で引く |
| bold | エッジを太線で引く |
サンプル
digraph edge_sample {
  //graph settings
  graph [
    charset = "UTF-8";
    label = "edge simple",
    labelloc = "t",
    labeljust = "c",
    bgcolor = "#343434",
    fontcolor = white,
    fontsize = 18,
    style = "filled",
    rankdir = TB,
    margin = 0.2
  ];
  // node common settings
  node [
    colorscheme = rdylgn11,
    fontname = "Migu 1M",
    color = 7,
    fontsize = 16,
    fontcolor = 6,
    fillcolor = 11,
    mirgin = 0.1
  ];
  // edge common settings
  edge [
    color = white,
    fontcolor = white
  ];

  // node define
  alpha [shape = box, label = "alpha", style = "solid,filled"];
  beta [shape = box, label = "beta", style = "dashed,filled"];
  gamma [shape = box, label = "gamma", style = "dotted,filled"];
  delta [shape = box, label = "delta", style = "bold,filled"];
  epsilon [shape = box, label = "epsilon", style = "rounded,filled"];
  zeta [shape = box, label = "zeta", style = "diagonals,filled"];
  eta [shape = box, label = "eta", style = "solid,striped", fillcolor = "8:9:10:11"];
  theta [shape = ellipse, label = "theta", style = "solid,wedged", fillcolor = "8:9:10:11"];

  // edge define
  alpha -> beta [style = "solid", label = "solid"];
  gamma -> delta [style = "dashed", label = "dashed"];
  epsilon -> zeta [style = "dotted", label = "dotted"];
  eta -> theta [style = "bold", label = "bold"];
}
arrows
エッジの先端の形状を設定することができます。
下記は形状の設定に使う属性です。
- dir : エッジの矢印の表示タイプを指定します。
- arrowhead : エッジの終端の矢印のタイプを指定します。
- arrowtail : エッジの始端の矢印のタイプを指定します。
- arrowsize : 矢印のサイズの大きさを指定します。
headとtail
NodeAからNodeBに向かってエッジが出ている例でいうと、エッジのNodeA側はtail(始端)であり、NodeB側はhead(終端)となります。
                --Forward-->
  +-----------+               +-----------+
  |  NodeA   (t)---[Edge]--->(h)   NodeB  |
  +-----------+               +-----------+
                <----back----
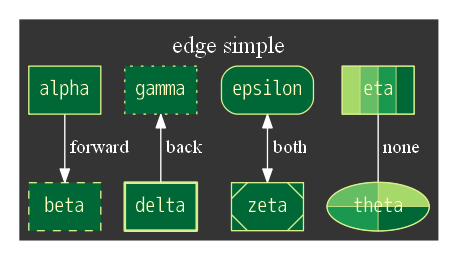
dirType
dirType属性でエッジの矢印の向きを設定することができます。
下記は設定できる値の種類です。
- forward : エッジの終端に矢印を表示します。
- back : エッジの始端に矢印を表示します。
- both : エッジの両端に矢印を表示します。
- none : 矢印を表示しません。
サンプル
digraph edge_sample {
  //graph settings
  graph [
    charset = "UTF-8";
    label = "edge simple",
    labelloc = "t",
    labeljust = "c",
    bgcolor = "#343434",
    fontcolor = white,
    fontsize = 18,
    style = "filled",
    rankdir = TB,
    margin = 0.2,
    pad = 0.1
  ];
  // node common settings
  node [
    colorscheme = rdylgn11,
    fontname = "Migu 1M",
    color = 7,
    fontsize = 16,
    fontcolor = 6,
    fillcolor = 11,
    mirgin = 0.1
  ];
  // edge common settings
  edge [
    color = white,
    fontcolor = white
  ];

  // node define
  alpha [shape = box, label = "alpha", style = "solid,filled"];
  beta [shape = box, label = "beta", style = "dashed,filled"];
  gamma [shape = box, label = "gamma", style = "dotted,filled"];
  delta [shape = box, label = "delta", style = "bold,filled"];
  epsilon [shape = box, label = "epsilon", style = "rounded,filled"];
  zeta [shape = box, label = "zeta", style = "diagonals,filled"];
  eta [shape = box, label = "eta", style = "solid,striped", fillcolor = "8:9:10:11"];
  theta [shape = ellipse, label = "theta", style = "solid,wedged", fillcolor = "8:9:10:11"];

  // edge define
  alpha -> beta [style = "solid", label = " forward", dir = forward];
  gamma -> delta [style = "solid", label = " back", dir = back];
  epsilon -> zeta [style = "solid", label = " both", dir = both];
  eta -> theta [style = "solid", label = " none", dir = none];
}
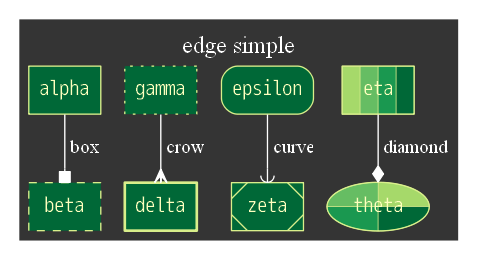
Arrow Shapes
エッジの矢印の形状を設定することができます。
下記はエッジの矢印の種類です。
| name | family |
|---|---|
| box | lbox,rbox,obox,olbox,orbox |
| crow | lcrow,rcrow |
| curve | lcurve,rcurve |
| diamond | ldiamond,rdiamond,odiamond,oldiamond,ordiamond |
| dot | odot |
| inv | linv,rinv,oinv,olinv,orinv |
| none | |
| normal (default) | lnormal,rnormal,onormal,olnormal,ornormal |
| tee | ltee,rtee |
| vee | lvee,rvee |
prefix
- l : エッジの左側の部分のみを残して形状をクリップ。
- r : エッジの右側の部分のみを残して形状をクリップ。
- o : 矢印を塗つぶさないバージョンを使用します。
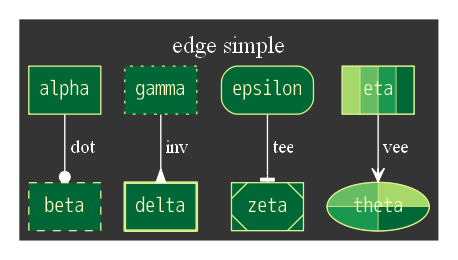
サンプル1
// edge define
alpha -> beta [style = "solid", label = " box", arrowhead = box];
gamma -> delta [style = "solid", label = " crow", arrowhead = crow];
epsilon -> zeta [style = "solid", label = " curve", arrowhead = curve];
eta -> theta [style = "solid", label = " diamond", arrowhead = diamond];
サンプル2
// edge define
alpha -> beta [style = "solid", label = " dot", arrowhead = dot];
gamma -> delta [style = "solid", label = " inv", arrowhead = inv];
epsilon -> zeta [style = "solid", label = " tee", arrowhead = tee];
eta -> theta [style = "solid", label = " vee", arrowhead = vee];
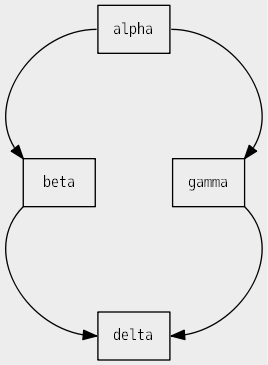
接続ポート
headport、tailport属性でエッジの始端と終端の位置を指定することができます。
指定できる値は下記の通りです。
| value | position |
|---|---|
| n | 上 (北) |
| ne | 右上 (北東) |
| e | 右 (東) |
| se | 右下 (南東) |
| s | 下 (南) |
| sw | 左下 (南西) |
| w | 左 (西) |
| nw | 左上 (北西) |
| c | 中央 |
| _ | 自動 (default) |
下記は正方形のノードを例にしたポートの位置です。
  +---+---+---+
  |nw | n | ne|
  +---+---+---+
  | w |   | e |
  +---+---+---+
  |sw | s | se|
  +---+---+---+
サンプル
digraph graph_name {
  graph [
    charset = "UTF-8",
    bgcolor = "#EDEDED",
    rankdir = TB,
    nodesep = 0.8,
    ranksep = 1.1
  ];

  node [
    shape = rect,
    fontname = "Migu 1M",
    fontsize = 12
  ];

  alpha [label = "alpha"];
  beta [label = "beta"];
  gamma [label = "gamma"];
  delta [label = "delta"];

  {rank = min; alpha;}
  {rank = same; beta; gamma;}
  {rank = max; delta;}

  alpha -> beta [tailport = w, headport = nw];
  alpha -> gamma [tailport = e, headport = ne];
  beta -> delta [tailport = sw, headport = w];
  gamma -> delta [tailport = se, headport = e];
}
command line tool
dot.exe
dot.exeはdotファイルを読み込んで指定したフォーマットの画像ファイルへ出力するCUIのツールです。
> dot.exe -Kdot -Tpng graph_sample.dot -ograph_sample.png
- -Kv : vにはレイアウトエンジンを指定します。
- -Tv : vには出力フォーマットを指定します。
- -ofile : fileには出力ファイル名を指定します。
引数
引数にグラフの属性名と値を指定して実行するとその属性を上書きして画像ファイルを生成することができます。
- -Gname : nameにグラフの属性名を指定します。
- -Nname : nameにノードの属性名を指定します。
- -Ename : nameにエッジの属性名を指定します。
下記はグラフのラベルを引数で指定する例です。-Glabelでグラフのlabel属性の値を上書きします。
> dot.exe -v -Glabel="new title" -Kdot -Tpng graph_sample.dot -ograph_sample.png
Usage
D:\dev\graphviz-2.38\bin>dot.exe -?
Usage: dot [-Vv?] [-(GNE)name=val] [-(KTlso)<val>] <dot files>
(additional options for neato)    [-x] [-n<v>]
(additional options for fdp)      [-L(gO)] [-L(nUCT)<val>]
(additional options for memtest)  [-m<v>]
(additional options for config)  [-cv]

 -V          - Print version and exit
 -v          - Enable verbose mode
 -Gname=val  - Set graph attribute 'name' to 'val'
 -Nname=val  - Set node attribute 'name' to 'val'
 -Ename=val  - Set edge attribute 'name' to 'val'
 -Tv         - Set output format to 'v'
 -Kv         - Set layout engine to 'v' (overrides default based on command name)
 -lv         - Use external library 'v'
 -ofile      - Write output to 'file'
 -O          - Automatically generate an output filename based on the input filename with a .'format' appended. (Causes all -ofile options to be ignored.)
 -P          - Internally generate a graph of the current plugins.
 -q[l]       - Set level of message suppression (=1)
 -s[v]       - Scale input by 'v' (=72)
 -y          - Invert y coordinate in output

 -n[v]       - No layout mode 'v' (=1)
 -x          - Reduce graph

 -Lg         - Don't use grid
 -LO         - Use old attractive force
 -Ln<i>      - Set number of iterations to i
 -LU<i>      - Set unscaled factor to i
 -LC<v>      - Set overlap expansion factor to v
 -LT[*]<v>   - Set temperature (temperature factor) to v

 -m          - Memory test (Observe no growth with top. Kill when done.)
 -m[v]       - Memory test - v iterations.

 -c          - Configure plugins (Writes $prefix/lib/graphviz/config
               with available plugin information.  Needs write privilege.)
 -?          - Print usage and exit
gvedit.exe
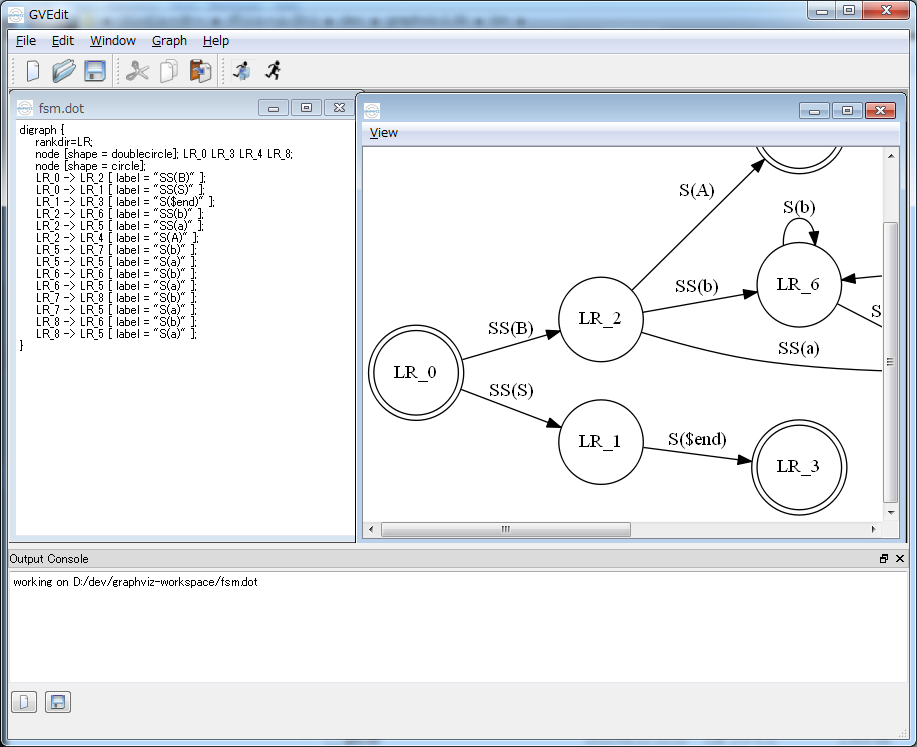
gveditはdotファイルの作成、編集およびグラフのプレビューを行うことができるGUIのツールです。
Attributes
属性の適用箇所
E,N,G,S,Cの意味は下記の通りです。
- E: edges
- N: nodes
- G: the root graph
- S: subgraphs
- C: cluster subgraphs
| name | E | N | G | S | C | type | default | notes |
|---|---|---|---|---|---|---|---|---|
| arrowhead | E | arrowType | normal | エッジの終端の形状を指定 | ||||
| arrowsize | E | double | 1.0 | 矢印の大きさ倍率で指定 | ||||
| arrowtail | E | arrowType | normal | エッジの始端の形状を指定 | ||||
| bgcolor | G | C | color,colorList | 背景色 | ||||
| center | G | bool | false | 中央に出力する | ||||
| charset | G | string | "UTF-8" | キャラクタセットを指定 | ||||
| color | E | N | C | color,colorList | black | 図形のカラー | ||
| colorscheme | E | N | G | C | string | "" | 図形のカラースキーマの名前空間を指定, colorやfillcolorはスキーマの色番号で指定できる | |
| comment | E | N | G | string | "" | コメント | ||
| compound | G | bool | false | クラスタ間のエッジを可能とする | ||||
| concentrate | G | bool | false | 同一ノードへのエッジの線を1つに束ねる | ||||
| dir | E | dirType | forward(directed),none(undirected) | エッジの矢印のタイプを指定する | ||||
| constraint | E | bool | true | ランク付けにエッジを考慮する | ||||
| distortion | N | double | 0.0 | shape=polygon | ||||
| fillcolor | E | N | color,colorList | lightgrey(N),black(C) | 塗つぶし色 | |||
| fixedsize | N | bool,string | false | ノードの大きさを指定可能にする 実際の大きさはheight/width | ||||
| fontcolor | E | N | G | C | color | black | フォントカラー | |
| fontname | E | N | G | C | string | "Times-Roman" | フォント名 | |
| fontpath | G | string | system-dependent | フォントを探すパス | ||||
| fontsize | E | N | G | C | double | 14.0 | フォントサイズ | |
| forcelabels | G | bool | true | |||||
| gradientangle | N | G | C | int | "" | グラデーション塗りの角度 | ||
| group | N | string | "" | グループ名 同じグループのノードをより近く配置する | ||||
| headlabel | E | lblString | "" | エッジの終端のラベル | ||||
| headport | E | portPos | center | エッジの終端を接続するポート | ||||
| height | N | double | 0.5 | ノードの高さ | ||||
| label | E | N | G | C | lblString | "\N" (nodes),"" (otherwise) | ラベル | |
| labelangle | E | double | -25.0 | ラベルの位置を角度で指定する | ||||
| labeldistance | E | double | 1.0 | ラベルの位置をノードからの距離で指定する | ||||
| labelfloat | E | bool | false | ラベルの重なりを許可する | ||||
| labelfontcolor | E | color | black | ラベルのフォントカラー | ||||
| labelfontname | E | string | "Times-Roman" | ラベルのフォント名 | ||||
| labelfontsize | E | double | 14.0 | ラベルのフォントサイズ | ||||
| labeljust | G | C | string | "c" | ラベル位置 r=right-justified, l=left-justified | |||
| labelloc | N | G | C | string | "t"(C),"b"(G),"c"(N) | ラベル位置 t=top, b=bottom, c=centered | ||
| landscape | G | bool | false | |||||
| layer | E | N | C | layerRange | "" | |||
| layerlistsep | G | string | "," | |||||
| layers | G | layerList | "" | |||||
| layerselect | G | layerRange | "" | |||||
| layersep | G | string | " :\t" | |||||
| layout | G | string | "" | グラフのレイアウトを指定します。デフォルトはdotです。 | ||||
| lhead | E | string | "" | エッジの終端をクリップするクラスターの名前 | ||||
| lheight | G | C | double | ラベルの高さ. (write only) | ||||
| lp | E | G | C | point | ||||
| ltail | E | string | "" | エッジの始端をクリップするクラスターの名前 | ||||
| lwidth | G | C | double | ラベルの幅. (write only) | ||||
| margin | N | G | C | double,point | ノードの場合はラベルのマージン、labelloc,fixedsizeが指定されている場合は無効 | |||
| nodesep | G | double | 0.25 | ノード間の距離 | ||||
| nojustify | E | N | G | C | bool | false | ||
| pad | G | double,point | 0.0555 (4 points) | パディングを指定 | ||||
| peripheries | N | C | int | shape default(N),1(C) | 枠線の重数 | |||
| ordering | N | G | string | "" | ||||
| orientation | N | double | 0.0 | |||||
| orientation | G | string | "" | |||||
| rank | S | rankType | ランクの指定 "same", "min", "source", "max", "sink" | |||||
| rankdir | G | rankdir | TB | 配置方向 TB, BT, LR, RL | ||||
| ranksep | G | double,doubleList | 0.5(dot),1.0(twopi) | 同一ランクのノード間の距離 | ||||
| ratio | G | double,string | ||||||
| regular | N | bool | false | |||||
| rotate | G | int | 0 | グラフの回転度 | ||||
| shape | N | shape | ellipse | ノードの形状 | ||||
| sides | N | int | 4 | shape=polygonの時.頂点の数を指定 | ||||
| size | G | double,point | グラフの最大サイズ | |||||
| skew | N | double | 0.0 | shape=polygon | ||||
| splines | G | bool,string | エッジの描画方法を指定する none,line(false),polyline,curved,ortho,spline(true) | |||||
| style | E | N | G | C | style | "" | 枠線のスタイル filled=塗つぶす | |
| taillabel | E | lblString | "" | エッジの始端のラベル | ||||
| tailport | E | portPos | center | エッジの始端を接続するポート | ||||
| weight | E | int,double | 1 | エッジの重み付け 重みが大きいエッジが結ぶノードがより近く配置される | ||||
| width | N | double | 0.75 | ノードの幅 |
colorList
typeがcolorListの属性は下記のように複数の色を指定できます。
color = "white:red:yellow"
color = "#EFEFEF:#F0F0F0:#ADADAD"
rankdir
- TB : top to bottom.
- BT : bottom to top.
- LR : left to right.
- RL : right to left.
メモ
layout
レイアウトエンジンについて
circo
circo draws graphs using a circular layout (see Six and Tollis, GD ’99 and ALENEX ’99, and Kaufmann
and Wiese, GD ’02.) The tool identifies biconnected components and draws the nodes of the component on
a circle.fdp
fdp draws undirected graphs using a ‘spring’ model. It relies on a force-directed approach in the spirit of
Fruchterman and Reingold (cf. Software-Practice & Experience 21(11), 1991, pp. 1129-1164).neato
neato draws undirected graphs using a ‘spring’ model and reducing the related energy (see Kamada and
Kawai, Information Processing Letters 31:1, April 1989).osage
osage draws the graph using its cluster structure. For a given cluster, each of its subclusters is laid out internally
sfdp
sfdp also draws undirected graphs using the ‘spring’ model described above, but it uses a multi-scale
approach to produce layouts of large graphs in a reasonably short timetwopi
twopi draws graphs using a radial layout (see G. Wills, Symposium on Graph Drawing GD’97, September,
1997). Basically, one node is chosen as the center and put at the origin.
