微分フィルタの求め方、基礎
http://qiita.com/shim0mura/items/5d3cbef873f2dd81d82c
OpenCVはSobelフィルタとラプラシアンフィルタをかける機能がある。
Sobelフィルタ
cv2.Sobel(src, ddepth, dx, dy[, dst[, ksize[, scale[, delta[, borderType]]]]]) → dst
http://docs.opencv.org/3.0-last-rst/modules/imgproc/doc/filtering.html?highlight=laplacian#sobel
- src: 入力画像
- dst: 出力画像
- ddepth: 出力の色深度
- dx: x方向の微分の次数
- dy: y方向の微分の次数
- ksize: カーネルサイズ、1, 3, 5, 7のどれかを指定
カーネルサイズが1の時は1x3のカーネルか3x1のカーネルを使うよと書いてあるけど、k=5,7の場合はどうなるんだろうと思うとこんな感じになるらしい。
http://stackoverflow.com/questions/9567882/sobel-filter-kernel-of-large-size
import cv2
from matplotlib import pyplot as plt

img = cv2.imread('Lenna.jpg', 0)

sobelx = cv2.Sobel(img, cv2.CV_32F, 1, 0, ksize=3)
sobely = cv2.Sobel(img, cv2.CV_32F, 0, 1, ksize=3)
sobelx5 = cv2.Sobel(img, cv2.CV_32F, 1, 0, ksize=5)
sobely5 = cv2.Sobel(img, cv2.CV_32F, 0, 1, ksize=5)

plt.subplot(2,2,1),plt.imshow(sobelx,cmap = 'gray')
plt.title('Sobel X k=3'), plt.xticks([]), plt.yticks([])
plt.subplot(2,2,2),plt.imshow(sobely,cmap = 'gray')
plt.title('Sobel Y k=3'), plt.xticks([]), plt.yticks([])
plt.subplot(2,2,3),plt.imshow(sobelx5,cmap = 'gray')
plt.title('Sobel X k=5'), plt.xticks([]), plt.yticks([])
plt.subplot(2,2,4),plt.imshow(sobely5,cmap = 'gray')
plt.title('Sobel Y k=5'), plt.xticks([]), plt.yticks([])
plt.show()
結果:
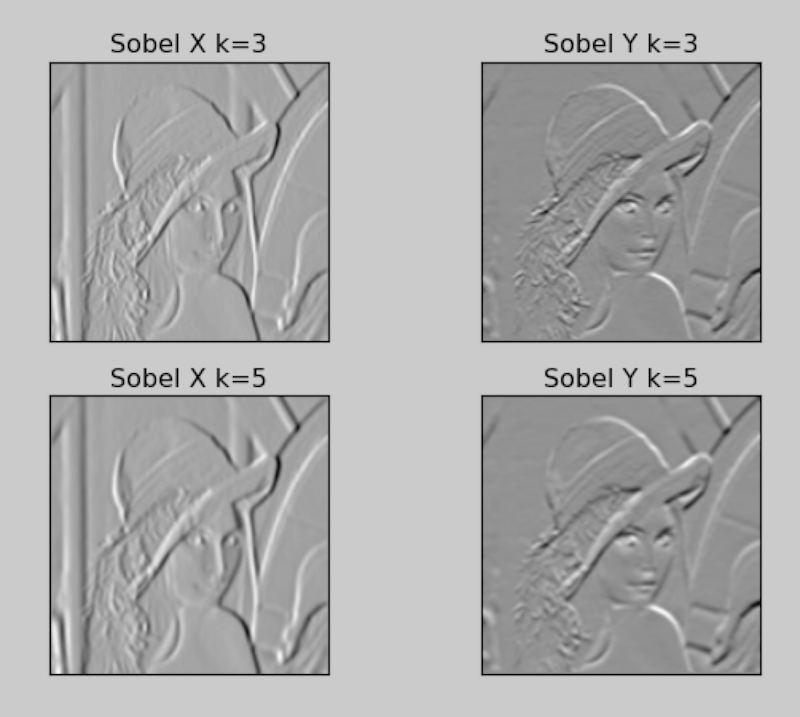
k=3のときよりk=5のほうが線が濃くなってぼかしが強くなっている。
ラプラシアンフィルタ
cv2.Laplacian(src, ddepth[, dst[, ksize[, scale[, delta[, borderType]]]]]) → dst
http://docs.opencv.org/3.0-last-rst/modules/imgproc/doc/filtering.html?highlight=laplacian#laplacian
- src: 入力画像
- dst: 出力画像
- ddepth: 出力の色深度
- ksize: カーネルサイズ
ラプラシアンなので1次微分のものと違って方向の指定はいらない。
import cv2
from matplotlib import pyplot as plt

lap = cv2.Laplacian(img, cv2.CV_32F)
lap5 = cv2.Laplacian(img, cv2.CV_32F,ksize=3)

plt.subplot(1,2,1),plt.imshow(lap,cmap = 'gray')
plt.title('Laplacian'), plt.xticks([]), plt.yticks([])
plt.subplot(1,2,2),plt.imshow(lap5,cmap = 'gray')
plt.title('Laplacian k=3'), plt.xticks([]), plt.yticks([])

plt.show()
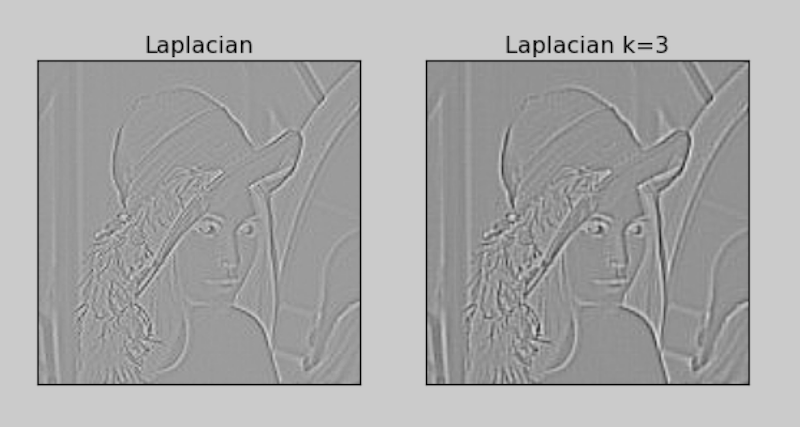
結果:
参考:
ディジタル画像処理(https://www.cgarts.or.jp/book/img_engineer/)
http://labs.eecs.tottori-u.ac.jp/sd/Member/oyamada/OpenCV/html/py_tutorials/py_imgproc/py_gradients/py_gradients.html#gradients
http://qiita.com/supersaiakujin/items/494cc16836738b5394c8