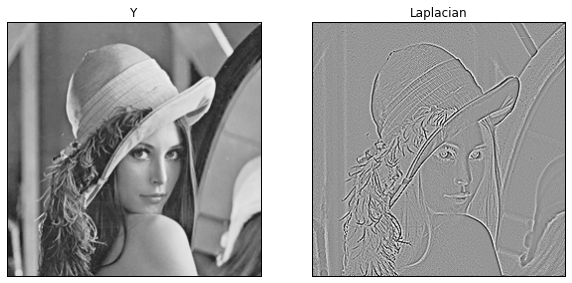
laplacian
cv2.Laplacian(src, ddepth[, dst[, ksize[, scale[, delta[, borderType]]]]])
img = cv2.imread('./data/SIDBA/Lenna.bmp')
imgRGB = cv2.cvtColor(img, cv2.COLOR_BGR2RGB)
imgYUV = cv2.cvtColor(img, cv2.COLOR_BGR2YUV)
imgY = imgYUV[:,:,0]


result = cv2.Laplacian(imgY, cv2.CV_64F)
fig, axes = plt.subplots(ncols=2, figsize=(10,5))
axes[0].imshow(imgY, cmap=cm.Greys_r, vmin=0, vmax=255)
axes[0].set_title('Y')
axes[0].get_xaxis().set_visible(False)
axes[0].get_yaxis().set_visible(False)
axes[1].imshow(result, cmap=cm.Greys_r, vmin=-128, vmax=128)
axes[1].set_title('Laplacian')
axes[1].get_xaxis().set_visible(False)
axes[1].get_yaxis().set_visible(False)
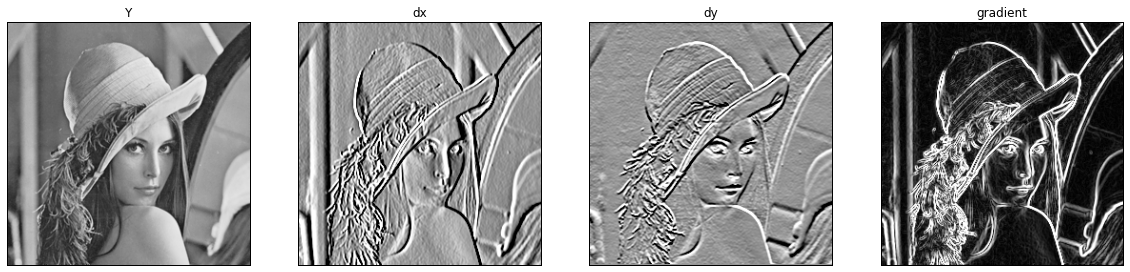
Sobel
cv2.Sobel(src, ddepth, dx, dy[, dst[, ksize[, scale[, delta[, borderType]]]]])
dx = cv2.Sobel(imgY, cv2.CV_64F, 1, 0, ksize=3)
dy = cv2.Sobel(imgY, cv2.CV_64F, 0, 1, ksize=3)
grad = np.sqrt(dx ** 2 + dy ** 2)
fig, axes = plt.subplots(ncols=4, figsize=(20,5))
axes[0].imshow(imgY, cmap=cm.Greys_r, vmin=0, vmax=255)
axes[0].set_title('Y')
axes[0].get_xaxis().set_visible(False)
axes[0].get_yaxis().set_visible(False)
axes[1].imshow(dx, cmap=cm.Greys_r, vmin=-128, vmax=128)
axes[1].set_title('dx')
axes[1].get_xaxis().set_visible(False)
axes[1].get_yaxis().set_visible(False)
axes[2].imshow(dy, cmap=cm.Greys_r, vmin=-128, vmax=128)
axes[2].set_title('dy')
axes[2].get_xaxis().set_visible(False)
axes[2].get_yaxis().set_visible(False)
axes[3].imshow(grad, cmap=cm.Greys_r, vmin=0, vmax=255)
axes[3].set_title('gradient')
axes[3].get_xaxis().set_visible(False)
axes[3].get_yaxis().set_visible(False)
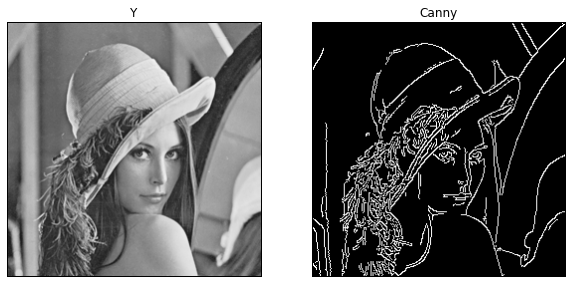
Canny
cv2.Canny(image, threshold1, threshold2[, edges[, apertureSize[, L2gradient]]])
Cannyの特徴は、Non-maximum SuppressionとHysteresis Thresholdingです。
Non-maximum Suppressionは、勾配方向の最大値だけ残して残りは消すというもので、これにより細線化されます。
処理としては勾配方向に3画素みて中心が最大値だったら残すという感じになります。
Hysteresis Thresholdingは、High ThresholdとLow Thresholdを用います。High Threshold以上は文句なくEdgeにします。Low Threshold以下は非Edgeにします。High Threshold と Low Thresholdの間の画像ですが、Edge画素と判定された画像に繋がっていればEdgeにします。High ThresholdとLow Thresholdの間でウロウロして途切れた線はEdgeにはなりませんが、High Threshold以上のEdge画素からつながっていてHigh ThresholdとLow Thresholdの間でウロウロしている線はEdgeになります。
result = cv2.Canny(imgY, 100, 200)
fig, axes = plt.subplots(ncols=2, figsize=(10,5))
axes[0].imshow(imgY, cmap=cm.Greys_r, vmin=0, vmax=255)
axes[0].set_title('Y')
axes[0].get_xaxis().set_visible(False)
axes[0].get_yaxis().set_visible(False)
axes[1].imshow(result, cmap=cm.Greys_r, vmin=0, vmax=255)
axes[1].set_title('Canny')
axes[1].get_xaxis().set_visible(False)
axes[1].get_yaxis().set_visible(False)
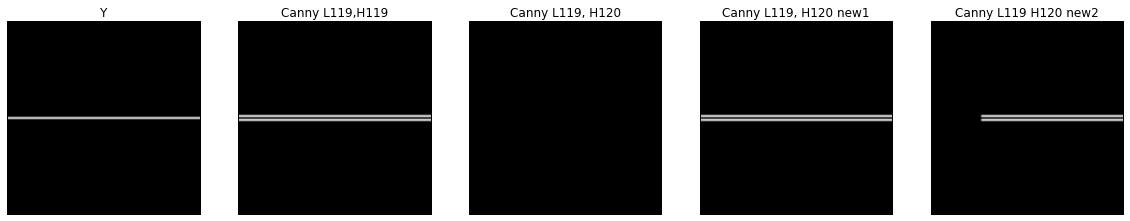
Hysteresis Thresholding
横1Lineの直線画像を作って、閾値を変えて結果を見ています。
ここでは100x100の画像の中心に値30の直線を引いたものを使用します。
**左から1番目:**原画像
**左から2番目:**Low/High Thresholdを119に設定したもの
**左から3番目:**Low Thresholdを119、High Thresholdを120に設定したもの
**左から4番目:**真ん中の画像を31にしてLow Thresholdを119、High Thresholdを120に設定したもの
**左から5番目:**左から1/4あたりの画素を29にしてLow Thresholdを119、High Thresholdを120に設定したもの
左から2番目の画像は、High Thresholdの値をEdgeが超えたのですべて検出されています。
左から3番目の画像は、High Thresholdを上げたのですべて検出されなくなりました。
左から4番目の画像は、真ん中の値を少し大きくして、High Thresholdを超えるようにしたため全部Edgeとして検出されるようになりました。
左から5番目の画像は、左から1/4あたりの画素を29にしてLow Threshold以下になるようにしたので、最初の1/4はEdgeとして検出されなくなりました。
この実験からHysteresis Thresholding処理がどんなことをしているか、なんとなく理解できたかと思います。
L = np.tile(30, 100)
P = np.zeros((100,100), dtype=np.uint8)
P[50,:] = L

result_L119_H119 = cv2.Canny(P,119,119)
result_L119_H120 = cv2.Canny(P,119,120)
P[50, 50] = 31
result_L119_H120_new = cv2.Canny(P,119,120)
P[50, 25] = 29
result_L119_H120_new2 = cv2.Canny(P,119,120)

fig, axes = plt.subplots(ncols=5, figsize=(20,5))
axes[0].imshow(P, cmap=cm.Greys_r, vmin=0, vmax=32)
axes[0].set_title('Y')
axes[0].get_xaxis().set_visible(False)
axes[0].get_yaxis().set_visible(False)
axes[1].imshow(result_H119_L119, cmap=cm.Greys_r, vmin=0, vmax=255)
axes[1].set_title('Canny L119,H119')
axes[1].get_xaxis().set_visible(False)
axes[1].get_yaxis().set_visible(False)
axes[2].imshow(result_H120_L120, cmap=cm.Greys_r, vmin=0, vmax=255)
axes[2].set_title('Canny L119, H120')
axes[2].get_xaxis().set_visible(False)
axes[2].get_yaxis().set_visible(False)
axes[3].imshow(result_H120_L120_new, cmap=cm.Greys_r, vmin=0, vmax=255)
axes[3].set_title('Canny L119, H120 new1')
axes[3].get_xaxis().set_visible(False)
axes[3].get_yaxis().set_visible(False)
axes[4].imshow(result_H120_L120_new2, cmap=cm.Greys_r, vmin=0, vmax=255)
axes[4].set_title('Canny L119 H120 new2')
axes[4].get_xaxis().set_visible(False)
axes[4].get_yaxis().set_visible(False)
Pyramid
cv2.pyrUp(src[, dst[, dstsize[, borderType]]]
cv2.pyrDown(src[, dst[, dstsize[, borderType]]]
pyramid 画像を作るにはpyrUp, pyrDownを使用します。
pyrUpは拡大で、pyrDownは縮小です。
サイズはそれぞれ$\times 2、\times \frac{1}{2}$になります。
pyrUp, pyrDownでは画像拡大、縮小時にfilterがconvolutionされます。
filterは$5\times 5$のGaussian filterです。
filterの値は下記の通りです。
\begin{equation}
\frac{1}{256}
\begin{bmatrix}
1 & 4 & 6 & 4 & 1 \\
4 & 16 & 24 & 16 & 4 \\
6 & 24 & 36 & 24 & 6 \\
4 & 16 & 24 & 16 & 4 \\
1 & 4 & 6 & 4 & 1 \\
\end{bmatrix}
\end{equation}
L = 3
tmp = imgY.copy()
pyImg = [tmp]
pyEdge = [cv2.Canny(tmp.astype(np.uint8),100,200 )]
for idx in xrange(L-1):
    tmp = cv2.pyrDown(tmp)
    pyImg.append(tmp)
    pyEdge.append(cv2.Canny(tmp.astype(np.uint8),100,200 ))
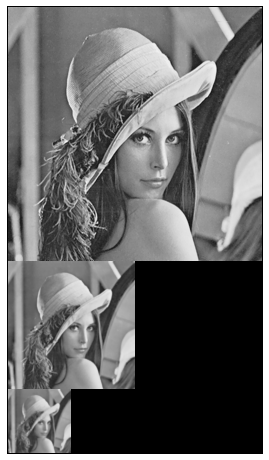
height = np.sum([img.shape[0] for img in pyImg])
width  = np.max([img.shape[1] for img in pyImg])
con_img = np.zeros((height, width), dtype=pyImg[0].dtype)
y = 0
for Y in pyImg:
    con_img[y:y+Y.shape[0],0:Y.shape[1]] = Y
    y += Y.shape[0]

fig,axes = plt.subplots(nrows=1, figsize=(8,8))
axes.imshow(con_img, cmap=cm.Greys_r, vmin=0, vmax=255)
axes.get_xaxis().set_visible(False)
axes.get_yaxis().set_visible(False)
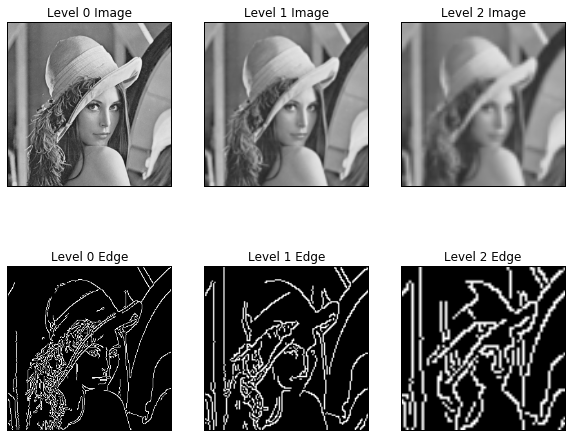
fig, axes = plt.subplots(ncols = 3,nrows=2, figsize=(10,8))
for idx, (Y, E) in enumerate(zip(pyImg, pyEdge)):
    axes[0,idx].imshow(Y, cmap=cm.Greys_r, vmin=0, vmax=255)
    axes[0,idx].set_title('Level %d Image' % idx)
    axes[0,idx].get_xaxis().set_visible(False)
    axes[0,idx].get_yaxis().set_visible(False)
    axes[1,idx].imshow(E, cmap=cm.Greys_r)
    axes[1,idx].set_title('Level %d Edge' % idx)
    axes[1,idx].get_xaxis().set_visible(False)
    axes[1,idx].get_yaxis().set_visible(False)