画像処理ライブラリに頼らず、行列演算だけで画像処理・図形描画をするお話。Pythonistaでも可能
「再発明家」とは
Open CVとかPillowに頼らず、numpyとmatplotlibを使って、様々な画像処理を実際に書いてみる。iOSアプリのPythonistaでも使える組み合わせだ。
import numpy as np
import matplotlib.pyplot as plt
また、画像表示には以下の関数が便利である。(詳しくは基礎編)
def img_show(img : np.ndarray, cmap = 'gray', vmin = 0, vmax = 255, interpolation = 'none') -> None:
    '''np.arrayを引数とし、画像を表示する。'''

    #dtypeをuint8にする
    img = np.clip(img,vmin,vmax).astype(np.uint8)

    #画像を表示
    plt.imshow(img, cmap = cmap, vmin = vmin, vmax = vmax, interpolation = interpolation)
    plt.show()
    plt.close()
図形描画
図形を描画するには、mgridを用いることで、画像上の座標を取得する。
x, y = np.mgrid[:100,:100]
ここで、$x$の正方向が下、$y$の正方向が右向きであることに注意してほしい。
長方形の描画
$(2\times|x-x_0|<x_{size} \land 2\times|y-y_0|<y_{size})$
x, y = np.mgrid[:100,:100]
x_0, y_0 = (50, 60) #中央の点
x_size, y_size = (10, 20) #長方形の大きさ

# 長方形の描画
rect = ((2*abs(x - x_0) < x_size) & (2*abs(y - y_0) < y_size)).astype(np.uint8)
img_show(rect*255)
楕円の描画
$\frac{(x-x_0)^2}{a^2} + \frac{(y-y_0)^2}{b^2} - 1 < 0$を用いる。
x, y = np.mgrid[:100,:100]
x_0, y_0 = (20, 40) #中央の点
a, b = (5, 10)
ellipse = ((x - x_0)**2/a**2 + (y - y_0)**2/b**2 - 1<0).astype(np.uint8)

img_show(ellipse*255)
ブレゼンハムのアルゴリズム(擬き)による直線描画
ブレゼンハムのアルゴリズムの誤差関数を使ってみた。
直線M:$ax+by+c=0$の描画をしたいとする。$a\geq -b \geq 0,a>0$という条件を設定すると、各縦列ごとに点を1つ描画して、直線Mを近似すればよい。
言い換えると、各$y$に対して、十分Mに近い$x$を一つ選べばよい。
あるピクセルの中心点A:$(x_1, y_1)$とし、
$y$座標が一致するM上の点B:$\left(-\frac{b}{a}y - \frac{c}{a},y_1\right)$を考えると、その点Aに対する$x$座標の差$e$は$-\frac{b}{a}y_1-\frac{c}{a}-x_1$となる。
すると、十分Mに近いという条件は、$0.5\leq e <0.5$と書ける。なぜなら、同じ点Aと点Bが同じピクセル内にあるからだ。
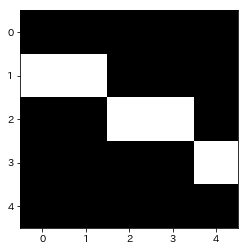
x,y = np.mgrid[:5,:5]
a,b,c = 2,-1,-1
e = -(b/a)*y-c/a-x

# array([[ 0.5,  1. ,  1.5,  2. ,  2.5],
#       [-0.5,  0. ,  0.5,  1. ,  1.5],
#       [-1.5, -1. , -0.5,  0. ,  0.5],
#       [-2.5, -2. , -1.5, -1. , -0.5],
#       [-3.5, -3. , -2.5, -2. , -1.5]])

line = ((-0.5<=e)&(e<0.5)).astype(np.uint8)

# array([[0, 0, 0, 0, 0],
#       [1, 1, 0, 0, 0],
#       [0, 0, 1, 1, 0],
#       [0, 0, 0, 0, 1],
#       [0, 0, 0, 0, 0]], dtype=uint8)
img_show(line*255)
浮動小数点数型が嫌な人は$e$を$2a$倍しよう。十分Mに近いという条件は、$-a\leq e <a$と書けることになる。
x,y = np.mgrid[:20,:20]
a,b,c = 2,-1,-1
e = 2*(-b*y-c-a*x)
line = ((-a<=e)&(e<a)).astype(np.uint8)
img_show(line*255)
最後に、$a==0 \land b==0$はないものとして、$a\geq -b \geq 0,a>0$ではない時を考えると、以下のアルゴリズムが適切なことが分かる。
x,y = np.mgrid[:20,:20]
a,b,c = 13,14,-200
e = 2*(-b*y-c-a*x)
threshold = max(abs(a),abs(b))
line = ((-threshold<=e)&(e<threshold)).astype(np.uint8)
img_show(line*255)
このアルゴリズムで生成される図形は、ブレゼンハムのアルゴリズムで生成される図形と同じである。
アンチエイリアス付きの直線 (4/5追加)
自作した。
詳しくはこちら
以上は$-3x-7y+60=0$を1000ピクセル四方の図形に描画した。
以下は、ブレゼンハムのアルゴリズムで作った直線。


