はじめに
今後諸々のモデルをFine-tuningすることを考えて、chainerでもその技術を身に付けたい。
今回はcaffe modelを読み込んで推論だけする。
参考にしたサイトはこちら
http://qiita.com/dsanno/items/2c9ccfc53b5019475e0e
など
環境
OS:Ubuntu14.04
GPU:GTX1070
CUDA:8.0 RC
cuDNN:5.1
python2.7.6
など
caffemodelをダウンロードする
今回使用するモデルはGoogLeNet。こちらから
http://dl.caffe.berkeleyvision.org/bvlc_googlenet.caffemodel
ダウンロードする。
画像をnumpy配列へ整形する
画像を入力に適したnumpy配列へ整形する。PILを使うので、事前にPillowのインストールが必要である。
まず画像の縦横のうち小さい方が224となるように縮小する。次に大きい方を切り取って(224*224)とする。これをfloat32のnumpy配列にする。
# -*- coding: utf-8 -*-
from chainer.functions import caffe
from PIL import Image
import numpy as np

image = Image.open('sample01.jpg').convert('RGB')
w_in, h_in = 224, 224 # GoogLeNet in_size
w_img, h_img = image.size # get the size of image

# reduce the size of image
if w_img > h_img:
    shape = (w_in * w_img / h_img, h_in)
else:
    shape = (w_in, h_in * h_img / w_img)
mod_img = image.resize(shape)

# cut both ends

x_space = (shape[0] - w_img) / 2
y_space = (shape[1] - h_img) / 2
in_img = mod_img.crop((x_space, y_space, x_space + w_img, y_space + h_img))
pixels = np.asarray(in_img).astype(np.float32)
次にnumpy配列を入力に適した形に整える。画像からnumpyを作成した時点では(y, x, RGB)となっている。これを(index, BGR, y ,x)とする。
#change RGB to BGR
pixels = pixels[:,:,::-1]

#change axis
pixels = pixels.transpose(2, 0, 1)
次に平均画像を引いた後、4次元にする
#subtract mean image
mean_img = np.ndarray((3, 224, 224), dtype=np.float32)
mean_img[0] = 103.939
mean_img[1] = 116.779
mean_img[2] = 123.68
pixels -= self.mean_img

#change to 4 dim
pixels = pixels.reshape(1, 3, 224, 224)
modelの形を確認する
caffemodelを読み込む前に、必要な情報を確認する。
以下のサイトにあるコードからmodelの形を確認する。
https://github.com/BVLC/caffe/blob/master/models/bvlc_googlenet/train_val.prototxt
name: "GoogleNet"
layer {
  name: "data"
  type: "Data"
  top: "data"
  top: "label"
  include {
    phase: TRAIN
}

.......
.......
.......

layer {
  name: "loss3/top-5"
  type: "Accuracy"
  bottom: "loss3/classifier"
  bottom: "label"
  top: "loss3/top-5"
  include {
    phase: TEST
  }
  accuracy_param {
    top_k: 5
  }
}
入力層のtopが"data"であり、出力層のbottomが"loss3/classifier"であることを確認。
caffemodelを読み込む
chainerの機能を使ってcaffemodelを読み込む。これにnumpy配列を入力する。
import chainer
import chainer.functions as F

#read caffemodel
func = caffe.CaffeFunction('bvlc_googlenet.caffemodel')

#define input and output
x = chainer.Variable(pixels, volatile=True)
y, = func(inputs={'data': x}, outputs=['loss3/classifier'],
        disable=['loss1/ave_pool', 'loss2/ave_pool'], train = False)
prediction = F.softmax(y)
`prediction[0]'が出力結果だが、数値ごとの確率として表示されている。この数値とラベルを対応させるラベル対応表をダウンロードする。
wget http://dl.caffe.berkeleyvision.org/caffe_ilsvrc12.tar.gz
tar xfvz caffe_ilsvrc12.tar.gz
awk '{$1="";print}' synset_words.txt > labels.txt
この表の1列目を捨て、2列目のラベルのみとし、label.txtへ保存する。
awk '{$1="";print}' synset_words.txt > labels.txt
結果を出力する
まずラベルを読み込む。その上でスコアとラベルを紐づけ、スコアの高い順にする。
#load labels
categories = np.loadtxt('labels.txt', str, delimiter="\n")
result = zip(prediction.data.reshape((prediction.data.size,)), categories)
result = sorted(result, reverse=True)

#print result of 1st to 5th
for i, (score, label) in enumerate(result[:5]):
    print '{:>3d} {:>6.2f}% {}'.format(i + 1, score * 100, label)
実行例
以下の写真は大宮駅で開催された福島県のPRイベントにて展示されていた恐竜です。
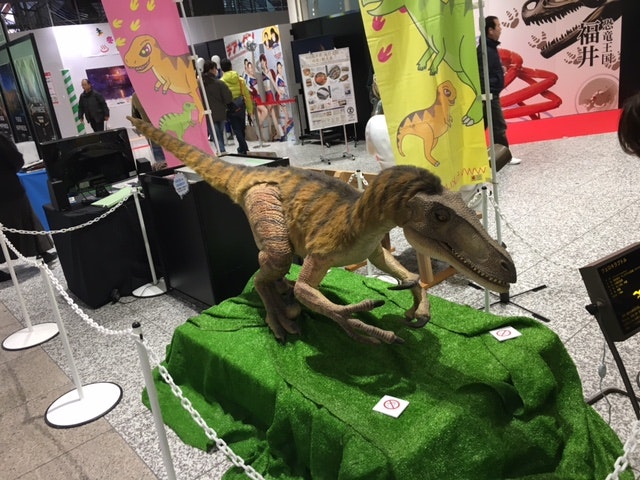
これの実行例は以下です。
python val_GoogLeNet.py
  1  45.46%  common iguana, iguana, Iguana iguana
  2  15.96%  triceratops
  3   8.78%  Chesapeake Bay retriever
  4   3.37%  tiger, Panthera tigris
  5   3.08%  frilled lizard, Chlamydosaurus kingi
イグアナが45%、トリケラトプスが16%。恐竜ではあるがイグアナに似た形状なので、遠からずといったところか。