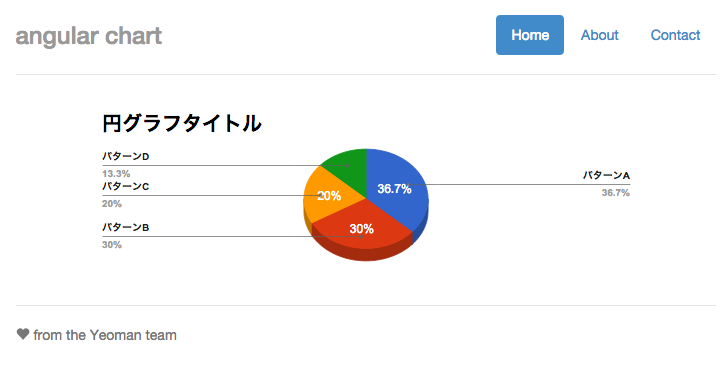
Angular.js+GoogleChartToolsでグラフ描画1(円グラフ)で描画したグラフのカスタマイズについて説明します。
typeとdata
GoogleChartToolsでグラフを描画するには最低でもtypeとdataを指定しないといけません。
今回は円グラフを描画したので下記のようになりました。
chart.type = "PieChart"; // 円グラフを描画
chart.data = [ // 円グラフに表示するデータを指定
	['title', 'val'],
	['パターンA', 55],
	['パターンB', 45]
];
typeには'PieChart'以外にも'ColumnChart'や'LineChart'等も指定できます。
詳しくはGoogle Charts — Google Developersを参照してください。
円グラフのoptions
optionsを指定することで円グラフをカスタマイズすることが出来ます。
'use strict';

angular.module('chartApp')
  .controller('MainCtrl', function ($scope) {
    $scope.testchart = createChart();
	function createChart() {
		var chart = {};
		chart.type = "PieChart";
		chart.data = [
			['title', 'val'],
			['パターンA', 55],
			['パターンB', 45],
			['パターンC', 30],
			['パターンD', 20]
		];
		chart.options = {
			title: '円グラフタイトル',
			is3D: true,
			titleTextStyle: {color:'#000', bold:true, fontSize:20},
			legend: {position:'labeled',textStyle:{fontSize:10,bold:true}}
		}
		return chart;
	}
  });
円グラフのoptionsに指定できる値には下記のようなものが有ります。
| プロパティ | 型 | 説明 |
|:-----------|:------------|:------------|:------------|
| backgroundColor | string or object| グラフの背景色を指定します。 |
| backgroundColor.fill | string | グラフの背景色を指定します。 |
| backgroundColor.stroke | string | グラフ描画領域の枠線の色を指定します。 |
| backgroundColor.strokeWidth | number | グラフ描画領域の枠線の太さを指定します。 |
| chartArea | object| グラフの位置/大きさを指定します。 |
| chartArea.backgroundColor | string or object| グラフの背景色を指定するようですが、backgroundColorとの違いが分からないので使っていません。 |
| chartArea.left | number or string | グラフの描画領域左端からのX座標を指定します。 |
| chartArea.top | number or string | グラフの描画領域上端からのY座標を指定します。 |
| chartArea.width | number or string | グラフの幅を指定します。 |
| chartArea.height | number or string | グラフの高さを指定します。 |
| colors | array | グラフの色を配列で指定します。 |
| enableInteractivity | boolean | trueを指定すると、グラフにrollover/選択した際にツールチップが表示されます。 ※ツールチップの表示のイベントは'tooltip.trigger'で指定します。 |
| fontSize | number | グラフ中に表示されるテキストのフォントサイズを指定します。 |
| fontName | string | グラフ中に表示されるテキストのフォント名を指定します。 |
| forceIFrame | boolean | trueの場合、iFrameにグラフを描画します。 |
| height | number | グラフの高さを指定します。 |
| is3D | boolean | trueで三次元円グラフ、falseで二次元円グラフが表示されます。 |
| legend | object | 凡例の表示の仕方を指定します。 |
| legend.alignment | string | 凡例の並びを指定します。 |
| legend.position | string | 凡例の表示位置を指定します。 |
| legend.maxLines | number | 凡例の最大行数を指定します。※legend.positionが'top'の場合のみ機能します。 |
| legend.textStyle | object | 凡例のテキストスタイルを指定します。 |
| pieHole | number | 0より大きく1未満の値を指定すると、ドーナツグラフを表示します。※is3Dがfalseの場合のみ機能します。 |
| pieSliceBorderColor | string | スライスの境界線の色を指定します。※is3Dがfalseの場合のみ機能します。 |
| pieSliceText | string | スライス上に表示する内容を指定します。 有効な値は'percent'(スライスのサイズの割合), 'value'(スライスの値), 'label'(スライスの名前), 'none'(なし) |
| pieSliceTextStyle | object | スライスのテキストスタイルを指定します。 |
| pieStartAngle | number | グラフの表示角を指定します。 || pieResidueSliceColor | string | まとめたスライスの色を指定します。 |
| pieResidueSliceLabel | string | まとめたスライスのラベルを指定します。 |
| reverseCategories | boolean | trueの場合、反時計回りにスライスを描画します。 |
| slices | array | 各スライスのフォーマットを指定します。 指定できるのは'color'(スライスの色), 'offset'(中心点からの距離0〜1), 'textStyle'(テキストスタイル) |
| sliceVisibilityThreshold | number | スライスを個別に表示する閾値を指定します。この閾値以下の割合のスライスは1つのスライスにまとめて表示されます。 |
| title | string | グラフのタイトルを指定します。 |
| titleTextStyle | objecgt | グラフのタイトルのテキストスタイルを指定します。 |
| tooltip | objecgt | ツールチップのプロパティを指定します。 |
| tooltip.showColorCode | boolean | trueの場合、ツールチップに各スライスの色の正方形を表示します。 |
| tooltip.text | text | ツールチップに表示する内容を指定します。 有効な値は'value'(値), 'percentage'(割合), 'both'(値と割合) |
| tooltip.textStyle | object | ツールチップのテキストスタイルを指定します。 |
| tooltip.trigger | string | ツールチップを表示させる方法を指定します。 有効な値は'focus'(要素にrolloverしたら表示), 'selection'(要素を選択したら表示), 'none'(ツールチップを表示しない) ※selectionを指定した際reverseCategoriesにtrueを指定していると、選択した要素と表示されるツールチップが一致しません。 |
| width | number | グラフの幅を指定します。 |
