はじめに
この記事の目的は,Kerasで学習したLSTMのモデルから,重みを抜き出し,フィードフォワード部分をnumpyで実装することです.
個人的な目的としては,Kerasをいじいじしてみたかったのです.
環境
- Python 3.6.1 :: Anaconda 4.4.0 (64-bit)
- Keras 2.0.5 (backend : tensorflow)
データの作成
データは深層学習ライブラリKerasでRNNを使ってsin波予測のデータをそのまま使わせてもらいました.
この記事はさらにRNNにsin波を学習させて予測してみたを参考にしているようなので,お二方に感謝です.
import pandas as pd
import math
import numpy as np

np.random.seed(0)
# 乱数の係数
random_factor = 0.05
# サイクルあたりのステップ数
steps_per_cycle = 80
# 生成するサイクル数
number_of_cycles = 50

df = pd.DataFrame(np.arange(steps_per_cycle * number_of_cycles + 1), columns=["t"])
df["sin_t"] = df.t.apply(lambda x: math.sin(x * (2 * math.pi / steps_per_cycle)+ np.random.uniform(-1.0, +1.0) * random_factor))

def _load_data(data, n_prev = 100):
    """
    data should be pd.DataFrame()
    """

    docX, docY = [], []
    for i in range(len(data)-n_prev):
        docX.append(data.iloc[i:i+n_prev].as_matrix())
        docY.append(data.iloc[i+n_prev].as_matrix())
    alsX = np.array(docX)
    alsY = np.array(docY)

    return alsX, alsY

def train_test_split(df, test_size=0.1, n_prev = 100):
    """
    This just splits data to training and testing parts
    """
    ntrn = round(len(df) * (1 - test_size))
    ntrn = int(ntrn)
    X_train, y_train = _load_data(df.iloc[0:ntrn], n_prev)
    X_test, y_test = _load_data(df.iloc[ntrn:], n_prev)

    return (X_train, y_train), (X_test, y_test)

length_of_sequences = 5
(X_train, y_train), (X_test, y_test) = train_test_split(df[["sin_t"]], n_prev =length_of_sequences)
モデルの作成
Kerasのドキュメントにもあるように,ここをとりあえず参照するのが良さそうでした.ここの下にあるOur modelの部分の,$V_o$がないモデルがKerasには実装されていました.
というわけで,以下のようにモデルを作って,ついでに予測もさせます.
from keras.models import Sequential
from keras.layers.core import Dense, Activation
from keras.layers.recurrent import LSTM

in_out_neurons = 1
h_num = 100

model = Sequential()
model.add(LSTM(h_num, activation="tanh", recurrent_activation="sigmoid", batch_input_shape=(None, length_of_sequences, in_out_neurons), return_sequences=False))
model.add(Dense(in_out_neurons))
model.add(Activation("linear"))
model.compile(loss="mean_squared_error", optimizer="rmsprop")
model.fit(X_train, y_train, batch_size=600, epochs=15, validation_split=0.05)

y_hat_keras = model.predict(X_test)
学習したパラメーターの取得
先ほど学習したモデルのパラメーターを取得します.これはget_weights()メソッドでできるようです.このメソッドは,keras.models.Sequentialオブジェクトにもkeras.layersオブジェクトにもあったので,以下のようにmodel.get_weights()で取得することも,model.layers[0].get_weights()で取得することもできます.
model.get_weights()でやるとどれがどのパラメーターだ?となるので,とりあえずmodel.layersなどを確認してからmodel.get_weights()で取得するのが良いように思います.
weights = model.get_weights()

W, U, b, W_out, b_out = model.get_weights()

print("W.shape : ", W.shape)
print("U.shape : ", U.shape)
print("b.shape : ", b.shape)
print("W_out.shape : ", W_out.shape)
print("b_out.shape : ", b_out.shape)

Wi = W[:,0:h_num]
Wf = W[:,h_num:2*h_num]
Wc = W[:,2*h_num:3*h_num]
Wo = W[:,3*h_num:]

print("Wi : ",Wi.shape)
print("Wf : ",Wf.shape)
print("Wc : ",Wc.shape)
print("Wo : ",Wo.shape)

Ui = U[:,0:h_num]
Uf = U[:,h_num:2*h_num]
Uc = U[:,2*h_num:3*h_num]
Uo = U[:,3*h_num:]

print("Ui : ",Ui.shape)
print("Uf : ",Uf.shape)
print("Uc : ",Uc.shape)
print("Uo : ",Uo.shape)

bi = b[0:h_num]
bf = b[h_num:2*h_num]
bc = b[2*h_num:3*h_num]
bo = b[3*h_num:]
print("bi : ",bi.shape)
print("bf : ",bf.shape)
print("bc : ",bc.shape)
print("bo : ",bo.shape)
元のコードを見ると,一つの配列の中に,input, forget, memory cell, outputの順に並べて重みを格納しているため,上のようにスライシングしています.
myフィードフォワード
元のドキュメントの数式部分に何次元の行列か書かれておらず,ちょっと読みにくかったのでその辺を丁寧にコメントで書きました.(かなりコードが読みにくくなった気がする)
def sigmoid(x):
    return 1.0 / (1.0 + np.exp(-x))

x = X_test
n = x.shape[0]

# initial
ht_1 = np.zeros(n*h_num).reshape(n,h_num) #h_{t-1}を意味する.
Ct_1 = np.zeros(n*h_num).reshape(n,h_num) ##C_{t-1}を意味する.

ht_list = []

for t in np.arange(x.shape[1]):
    xt = np.array(x[:,t,:])

	#it : t期目のinput gate
    it = sigmoid(np.dot(xt, Wi) + np.dot(ht_1, Ui) + bi)
    # it : (390, 100)
    # xt : (390, 1), Wi : (1, 100)
    # ht_1 : (390, 100), Ui : (100, 100)
    # bi : (100,)

	# Ct_tilda : メモリーセルのt期目の候補
    Ct_tilda = np.tanh(np.dot(xt, Wc) + np.dot(ht_1, Uc) + bc)
    # Ct_tilda : (390, 100)
    # xt : (390, 1), Wc : (1, 100)
    # ht_1 : (390, 100), Uc : (100, 100)
    # bc : (100,)

	# ft : t期目のforget gate
    ft = sigmoid(np.dot(xt, Wf) + np.dot(ht_1, Uf) + bf)
    # ft : (390, 100)
    # xt : (390, 1), Wf : (1, 100)
    # ht_1 : (390, 100), Uf : (100, 100)
    # bf : (100,)

	# t期目のメモリーセル
    Ct = it * Ct_tilda + ft * Ct_1

	# ot : t期目のoutput gate
    ot = sigmoid( np.dot(xt, Wo) + np.dot(ht_1, Uo) + bo)

    # ht : t期目のhidden layer
    ht = ot * np.tanh(Ct)
    ht_list.append(ht)

    ht_1 = ht
    Ct_1 = Ct

my_y_hat = np.dot(ht, W_out) + b_out
Kerasのドキュメントを見て,引数のactivationと recurrent_activation違いがよくわかりませんでしたが,中のコードを見ると,メモリーセル関連(Ct, Ct_tilde)の活性化関数がactivationで,各ゲート関連(it, ft, ot)の活性化関数がrecurrent_activationでした.
つまり,myフィードフォワードの中で,tanhを使っている部分がactivationで,sigmoidを使っている部分がrecurrent_activationです.
結果のプロット
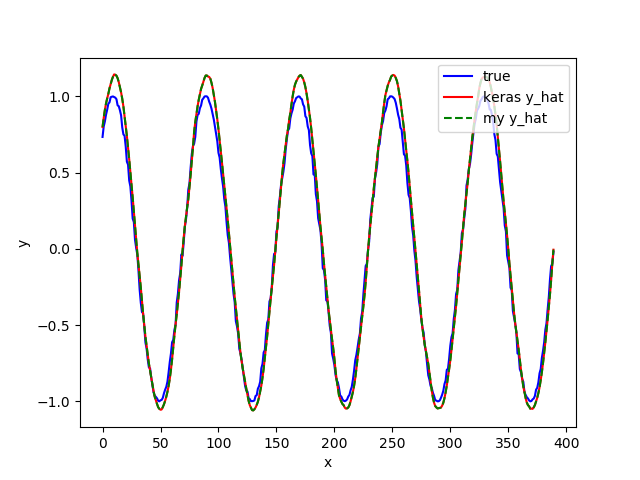
Kerasのy_hatとmy_y_hatの比較
import matplotlib.pyplot as plt

fig = plt.figure()
ax = fig.add_subplot(111)
ax.plot(y_test,label="true", color="blue")
ax.plot(y_hat_keras, label="keras y_hat", color="red")
ax.plot(my_y_hat, label="my y_hat", linestyle="dashed", color="green")
ax.legend(loc="upper right")
ax.set_ylabel("y")
ax.set_xlabel("x")
fig.savefig("./predict1.png")
いい感じじゃないでしょうか.
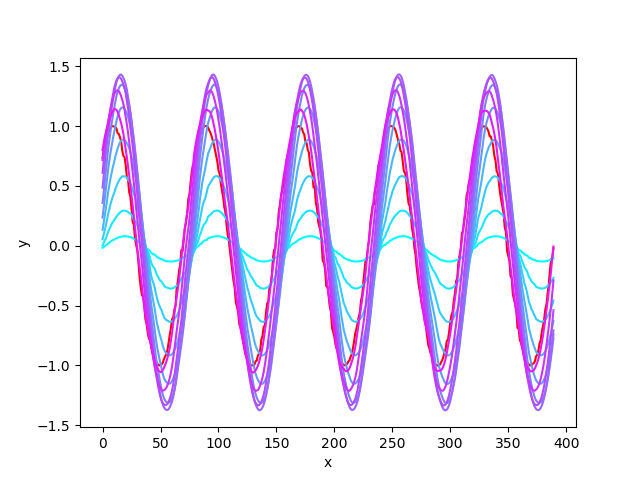
各tにおけるhtの比較
import matplotlib.cm as cm

fig = plt.figure()
ax = fig.add_subplot(111)
ax.plot(y_test, color="red")
for i in np.arange(len(ht_list)):
    y_hat_iter = np.dot(ht_list[i], W_out) + b_out
    ax.plot(y_hat_iter, color=cm.cool(i/len(ht_list)))

ax.set_ylabel("y")
ax.set_xlabel("x")
fig.savefig("./predict2.png")

plt.close("all")
tが大きくなるににつれて,水色が紫色になってゆきます.tが増えるにつれて真の値に近づいていることがわかります.
終わりに
定常でない信号とかでもやってみたいです.
Kerasは元のコードもpythonなので読みやすいです.しかも元のコードを読んでいるとなかなか実装の勉強になります.

