はじめに
以前、[Python] Plotlyでぐりぐり動かせるグラフを作るの記事で、インタラクティブなグラフを描画することができるPlotlyというライブラリを紹介しました。ただ、Plotlyの描画に至るまでに唱える呪文をいまいち覚えきれず、毎回どこかからコピペをしており、手軽に使用できないかなと常々思っていました。
そんな状況で、Cufflinksという、Pandasのデータフレームから、Plotlyを用いたグラフを一発で描画するライブラリを見つけたので紹介します。
Cufflinksのインストールと使いかた
インストールは、pip install cufflinksで完了です。
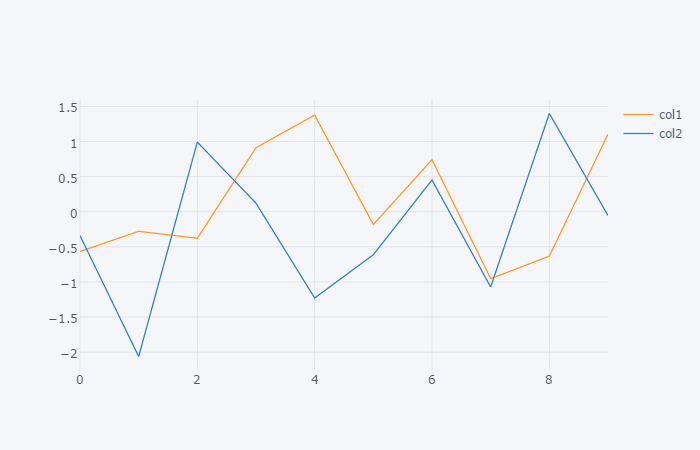
描画するには、Cufflinksをインポートしてから、df.plot()と同じように、df.iplot()と打ち込むだけと簡単!
import pandas as pd
import numpy as np
df = pd.DataFrame(np.random.randn(10, 2), columns=["col1", "col2"])

import cufflinks as cf
# デフォでPlotlyのオンラインモードとなっているのでオフラインモードへと変更
# 恒久的にデフォルトをオフラインモードとする方法は下に記述
cf.go_offline()
df.iplot()
細かい設定
細かい設定は、公式ページにあるTutorialsを参照ください。
また、使いそうな例を下記に示します。
デフォルト設定の変更
# オフラインモード、白基調のテーマ、リンク表示OFFをデフォルト設定に
cf.set_config_file(offline=True, theme="white", offline_show_link=False)
タイトル、初期表示領域の指定
df.iplot(xTitle="X軸名", yTitle="Y軸名", title="タイトル")
df.iplot(xrange=[0,5], yrange=[0,1])
散布図
df.iplot(kind="scatter" mode='markers', x="col1", y=["col2"]) # 系列は列名で指定
subplot
df.iplot(subplots=True, shape=(2,1), shared_xaxes=True)
第2Y軸プロット
fig = df.figure(secondary_y="col2", yTitle="ylabel", xTitle="xlabel")
fig.layout.yaxis2.title = "y2label"
cf.iplot(fig)