はじめに
前回と同じくGoogle Chart Toolsを使ってグラフを描いていきます。
今回はLineChartとグラフオプションの中からCrosshairsを用いて線グラフに垂直線*1を描きます。
*1株式チャートなどでバーディカルラインと呼ばれているものです。
今回の完成形
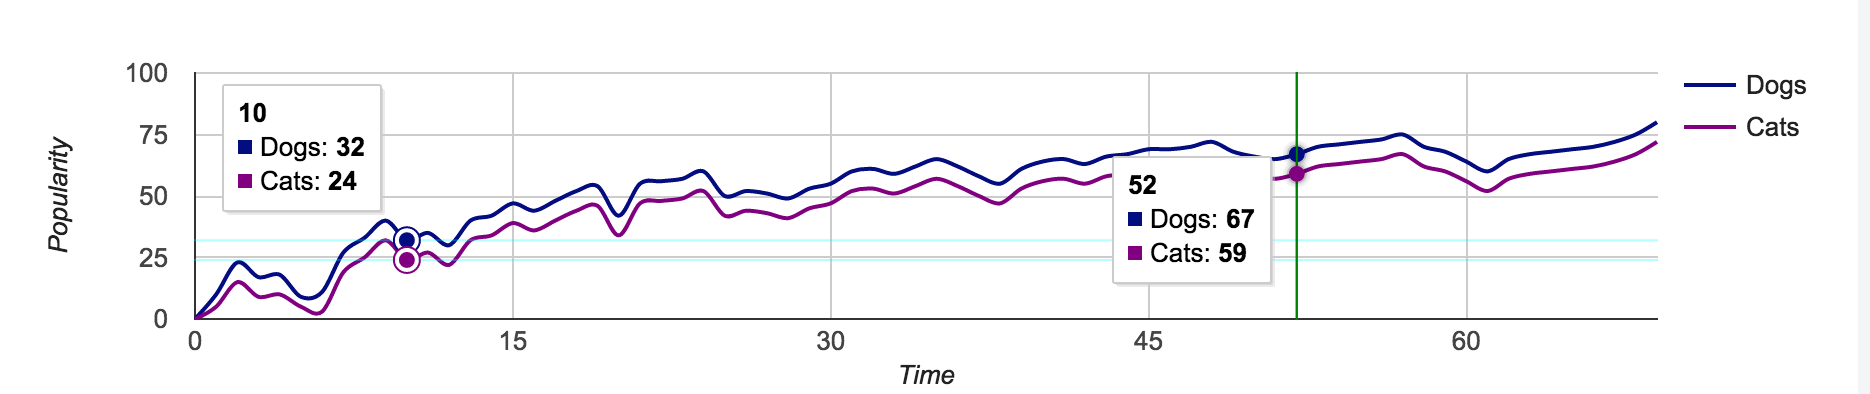
今回もサンプルデータは公式からお借りしました。
実際の動きは JSFiddle で確認できます。
コードの中身
html
<script type="text/javascript" src="https://www.gstatic.com/charts/loader.js"></script>
<div id="chart_div"></div>
javascript
google.charts.load('current', {packages: ['corechart', 'line']});
google.charts.setOnLoadCallback(drawCrosshairs);

function drawCrosshairs() {
  var data = new google.visualization.DataTable();
  data.addColumn('number', 'X');
  data.addColumn('number', 'Dogs');
  data.addColumn('number', 'Cats');
  data.addRows([
      [0, 0, 0], [1, 10, 5], [2, 23, 15], [3, 17, 9], [4, 18, 10], [5, 9, 5],
      [6, 11, 3], [7, 27, 19], [8, 33, 25], [9, 40, 32], [10, 32, 24],
      [11, 35, 27], [12, 30, 22], [13, 40, 32], [14, 42, 34], [15, 47, 39],
      [16, 44, 36], [17, 48, 40], [18, 52, 44], [19, 54, 46], [20, 42, 34],
      [21, 55, 47], [22, 56, 48], [23, 57, 49], [24, 60, 52], [25, 50, 42],
      [26, 52, 44], [27, 51, 43], [28, 49, 41], [29, 53, 45], [30, 55, 47],
      [31, 60, 52], [32, 61, 53], [33, 59, 51], [34, 62, 54], [35, 65, 57],
      [36, 62, 54], [37, 58, 50], [38, 55, 47], [39, 61, 53], [40, 64, 56],
      [41, 65, 57], [42, 63, 55], [43, 66, 58], [44, 67, 59], [45, 69, 61],
      [46, 69, 61], [47, 70, 62], [48, 72, 64], [49, 68, 60], [50, 66, 58],
      [51, 65, 57], [52, 67, 59], [53, 70, 62], [54, 71, 63], [55, 72, 64],
      [56, 73, 65], [57, 75, 67], [58, 70, 62], [59, 68, 60], [60, 64, 56],
      [61, 60, 52], [62, 65, 57], [63, 67, 59], [64, 68, 60], [65, 69, 61],
      [66, 70, 62], [67, 72, 64], [68, 75, 67], [69, 80, 72]
  ]);

  var options = {
    hAxis: {
      title: 'Time'
    },
    vAxis: {
      title: 'Popularity'
    },
    series: {
      0: { color: 'navy' },
      1: { color: 'purple' }
    },
    curveType: 'function',
    crosshair: {
      trigger: 'both',
      focused: {
        color: 'green',
        orientation: 'vertical'
      },
      selected: {
        color: 'aqua',
        opacity: 0.3,
        orientation: 'horizontal'
      }
    },
    tooltip: {
      trigger: 'both'
    },
    focusTarget: 'category'
  };

  var chart = new google.visualization.LineChart(document.getElementById('chart_div'));

  chart.draw(data, options);
}
Optionsについて
hAxis, vAxis, series, curveTypeの説明は省略させていただきます。
crosshair
triggerにはフォーカスのときも選択時も垂直線を引くように設定しています。
trigger: 'both',
focusedにはフォーカス時の色と線のタイプを設定しています。
color: 'green',
orientation: 'vertical'
selectedには選択時の色と透明度と線のタイプを設定しています。
color: 'aqua',
opacity: 0.3,
orientation: 'horizontal'
tooltip
triggerにはtooltipを表示するタイミングを設定しています。
※公式には'focus'か'none'か'selection'しかないけど'both'も設定できた。
'both'はフォーカス時と選択時の両方を指定しています。
trigger: 'both'
focusTarget
今回のグラフが複数ラインなのでフォーカスすると、複数のデータポイントに焦点を当て、ツールチップもすべてのカテゴリを表示するよう設定しています。
focusTarget: 'category'
最後に
今回はグラフに垂直線の描画を行いました。
サンプルのためフォーカス時と選択時でcrosshairの描画方向がかわるようになっていますが、実際使うときは同じタイプを指定するのが一般的かなと思います。