3次元の曲線をプロット
プロットするデータはこれ
Notebook
import numpy as np
theta = np.linspace(-4 * np.pi, 4 * np.pi, 100)
z = np.linspace(-2, 2, 100)
r = z**2 + 1
x = r * np.sin(theta)
y = r * np.cos(theta)
Matplotlib
Notebook
import matplotlib.pyplot as plt
from mpl_toolkits.mplot3d import axes3d    # <- 明示的には使わないが、インポートしておく必要がある。
# Notebook出力には次の1行が必要(%matplotlib inlineだとグラフを回転できない)
%matplotlib notebook

fig = plt.figure()
ax = fig.gca(projection='3d')    # <- axes3dをインポートしていないとエラーになる。
ax.plot(x, y, z)
plt.show()
 公式ドキュメント:[Line plots - mplot3d tutorial](http://matplotlib.org/mpl_toolkits/mplot3d/tutorial.html#line-plots)
Plotly
Notebook
from plotly.graph_objs import Scatter3d
from plotly.offline import init_notebook_mode, iplot
init_notebook_mode()    # <- Notebook出力にはこの1行が必要

scatter = Scatter3d(x=x, y=y, z=z, mode='lines')
iplot([scatter])    # <- Notebookに出力するにはiplot関数を使う
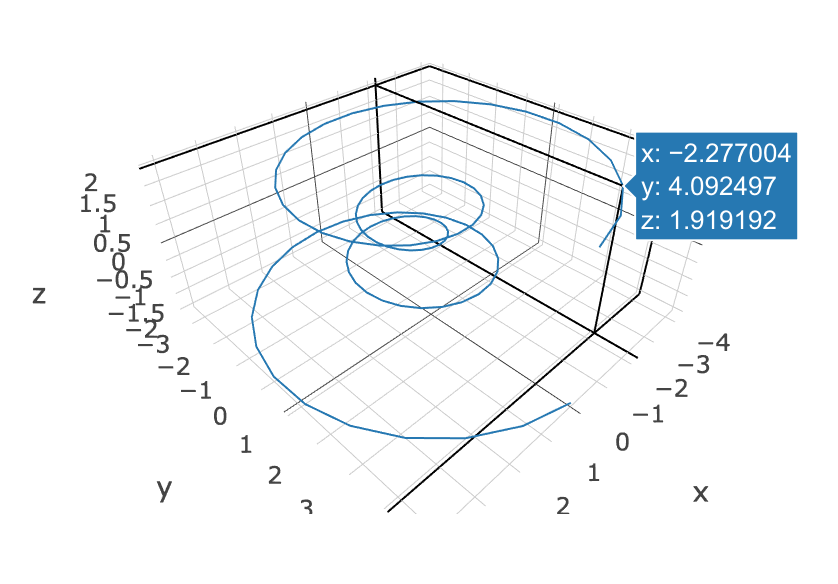 公式ドキュメント:[3D Line Plots in Python](https://plot.ly/python/3d-line-plots/)
Mayavi
Notebook
from mayavi import mlab
mlab.init_notebook()    # <- Notebook出力にはこの1行が必要

mlab.figure()
mlab.plot3d(x, y, z, tube_radius=0.1)    # tube_radiusは線の太さ(省略可)
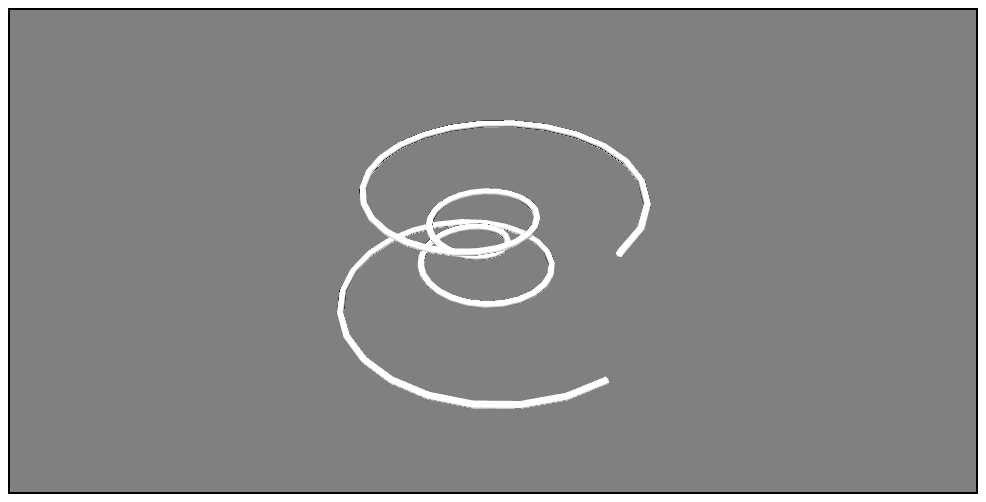 公式ドキュメント:[plot3d - Plotting functions](http://docs.enthought.com/mayavi/mayavi/auto/mlab_helper_functions.html#plot3d)
3次元の散布図をプロット
プロットするデータはこれ
Notebook
import numpy as np
X = np.random.uniform(-10, 10, 200)
Y = np.random.uniform(-10, 10, 200)
Z = np.random.uniform(-10, 10, 200)
Matplotlib
Notebook
import matplotlib.pyplot as plt
from mpl_toolkits.mplot3d import axes3d    # <- 明示的には使わないが、インポートしておく必要がある。
# Notebook出力には次の1行が必要(%matplotlib inlineだとグラフを回転できない)
%matplotlib notebook

fig = plt.figure()
ax = fig.gca(projection='3d')    # <- axes3dをインポートしていないとエラーになる。
scatter = ax.scatter3D(X, Y, Z,
                       s=5,                    # マーカーのサイズ
                       c=Z,                    # 色分けに使う数値(任意の数値を指定可)
                       cmap=plt.cm.viridis)    # 色のパターン
plt.colorbar(scatter)                          # カラーバーを表示(省略可)
plt.show()
 公式ドキュメント:[Scatter plots - mplot3d tutorial](http://matplotlib.org/mpl_toolkits/mplot3d/tutorial.html#scatter-plots)
Plotly
Notebook
from plotly.graph_objs import Scatter3d
from plotly.offline import init_notebook_mode, iplot
init_notebook_mode()    # <- Notebook出力にはこの1行が必要

# color、colorscale、showscaleは省略可
scatter = Scatter3d(x=X, y=Y, z=Z, mode='markers',
                    marker=dict(size=1,                  # マーカーのサイズ
                                color=Z,                 # 色分けに使う数値(任意の数値を指定可)
                                colorscale='Viridis',    # 色のパターン
                                showscale=True)          # カラーバーを表示
                   )

iplot([scatter])    # <- Notebookに出力するにはiplot関数を使う
 公式ドキュメント:[3D Scatter Plots in Python](https://plot.ly/python/3d-scatter-plots/)
Mayavi
Notebook
from mayavi import mlab
mlab.init_notebook()    # <- Notebook出力にはこの1行が必要

mlab.figure()
mlab.points3d(X, Y, Z,
              Z,                     # 色分けに使う数値(任意の数値を指定可)
              scale_mode='none',     # マーカーを同じサイズで表示
              scale_factor=0.5,      # マーカーのサイズ
              colormap='viridis')    # 色のパターン
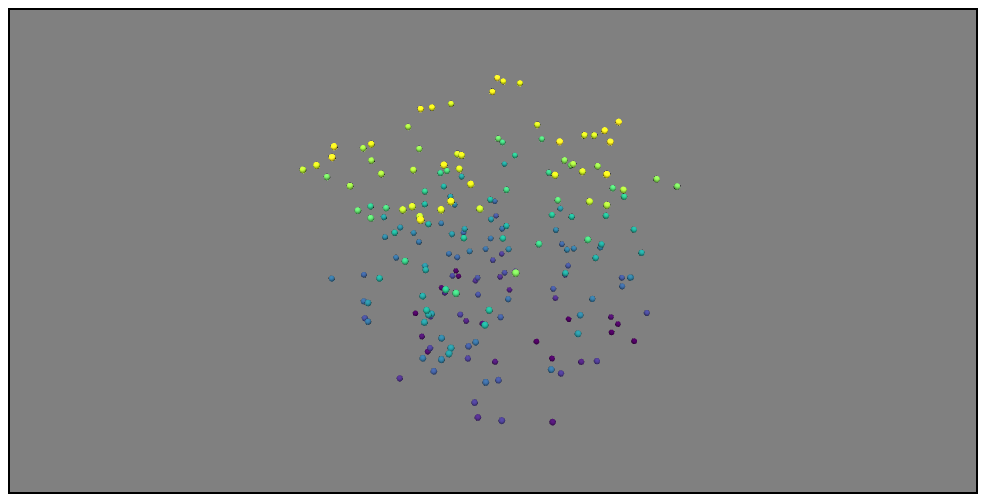 公式ドキュメント:[points3d - Plotting functions](http://docs.enthought.com/mayavi/mayavi/auto/mlab_helper_functions.html#points3d)
格子状に並んだ2.5次元データをプロット
プロットするデータはこれ
Notebook
from mpl_toolkits.mplot3d.axes3d import get_test_data
X, Y, Z = get_test_data()
Matplotlib
Notebook
import matplotlib.pyplot as plt
from mpl_toolkits.mplot3d import axes3d    # <- 明示的には使わないが、インポートしておく必要がある。
# Notebook出力には次の1行が必要(%matplotlib inlineだとグラフを回転できない)
%matplotlib notebook

fig = plt.figure()
ax = fig.gca(projection='3d')    # <- axes3dをインポートしていないとエラーになる。
ax.plot_surface(X, Y, Z,
                cmap=plt.cm.viridis)    # 色のパターン(省略可)
plt.show()
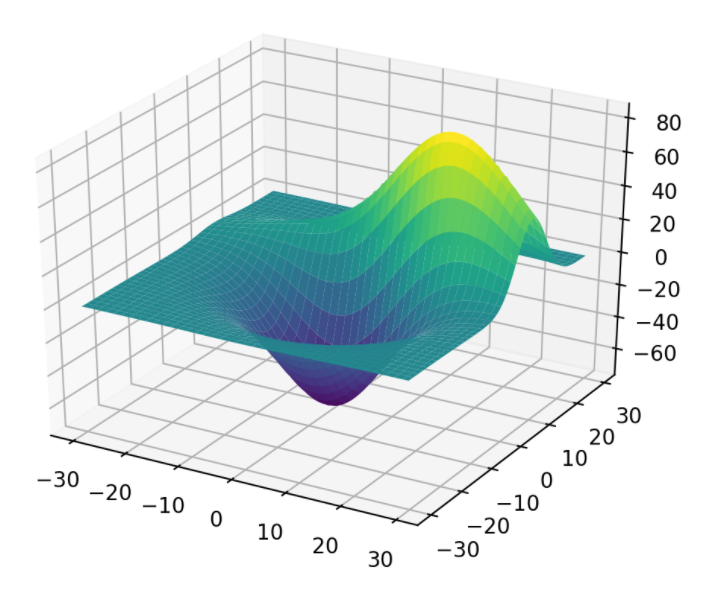 公式ドキュメント:[Surface plots - mplot3d tutorial](http://matplotlib.org/mpl_toolkits/mplot3d/tutorial.html#surface-plots)
Plotly
Notebook
from plotly.graph_objs import Surface
from plotly.offline import init_notebook_mode, iplot
init_notebook_mode()    # <- Notebook出力にはこの1行が必要

surface = Surface(x=X, y=Y, z=Z,
                  colorscale='Viridis')    # 色のパターン(省略可)
iplot([surface])    # <- Notebookに出力するにはiplot関数を使う
 公式ドキュメント:[3D Surface Plots in Python](https://plot.ly/python/3d-surface-plots/)
Mayavi
Notebook
from mayavi import mlab
mlab.init_notebook()    # <- Notebook出力にはこの1行が必要

mlab.figure()
mlab.surf(Z,
          colormap='viridis',    # 色のパターン
          warp_scale='auto')     # Z軸のスケールを自動的に調整する
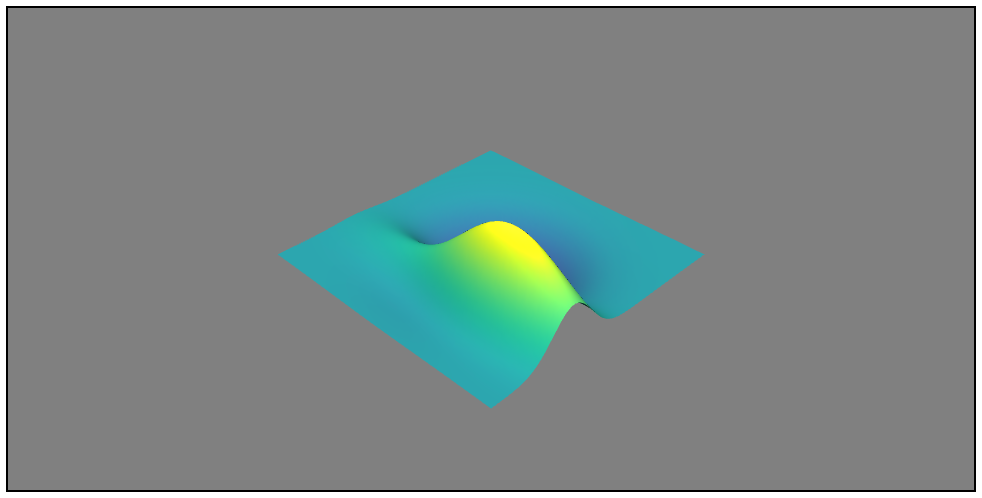 公式ドキュメント:[surf - Plotting functions](http://docs.enthought.com/mayavi/mayavi/auto/mlab_helper_functions.html#surf)
不規則に並んだ2.5次元データをプロット
プロットするデータはこれ
Notebook
import numpy as np
X = np.random.uniform(-10, 10, 1000)
Y = np.random.uniform(-10, 10, 1000)
Z = X ** 2 + Y ** 2
Matplotlib
Notebook
import matplotlib.pyplot as plt
from mpl_toolkits.mplot3d import axes3d    # <- 明示的には使わないが、インポートしておく必要がある。
# Notebook出力には次の1行が必要(%matplotlib inlineだとグラフを回転できない)
%matplotlib notebook

fig = plt.figure()
ax = fig.gca(projection='3d')                    # <- axes3dをインポートしていないとエラーになる。
ax.plot_trisurf(X, Y, Z, cmap=plt.cm.viridis)    # cmapは色のパターン(省略可)
plt.show()
 公式ドキュメント:[Tri-Surface plots - mplot3d tutorial](http://matplotlib.org/mpl_toolkits/mplot3d/tutorial.html#tri-surface-plots)
Plotly
Notebook
from plotly.graph_objs import Mesh3d
from plotly.offline import init_notebook_mode, iplot
init_notebook_mode()    # <- Notebook出力にはこの1行が必要

mesh = Mesh3d(x=X, y=Y, z=Z,
              delaunayaxis='z')    # 三角形分割する時に投影する方向
iplot([mesh])    # <- Notebookに出力するにはiplot関数を使う
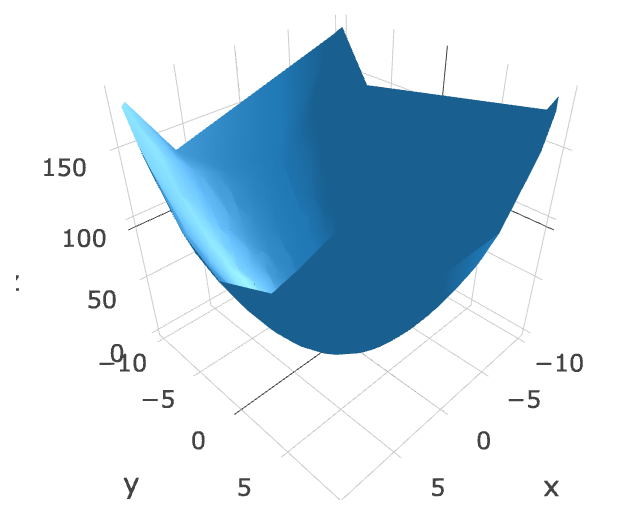 公式ドキュメント:[Surface Triangulation in Python](https://plot.ly/python/surface-triangulation/)
参考リンク
Jupyter notebookでMayaviを使う時の設定 - Qiita
Pythonの可視化パッケージの使い分け - Qiita
なんでもかんでもJupyter Notebookに表示するためのチートシート 2次元プロット編 - Qiita