やりたいこと
pythonパッケージの依存関係を簡単に見たいとします。
ここでは、graphvizで可視化する方法を説明します。
Ubuntu15.10で確認していますが、たぶん、windowsでもできます。
インストール
前提: Anacondaをインストール済みとします。
graphvizのインストールは、以下の通りです。condaでgraphviz本体を、pipでラッパーをインストールします。また、libltdl7というライブラリも必要でした。
bash
conda install -y graphviz
pip install graphviz
apt-get install -y libltdl7
パッケージの依存関係は、pipdeptreeを使います。インストールは以下の通り。
bash
pip install pipdeptree
実行
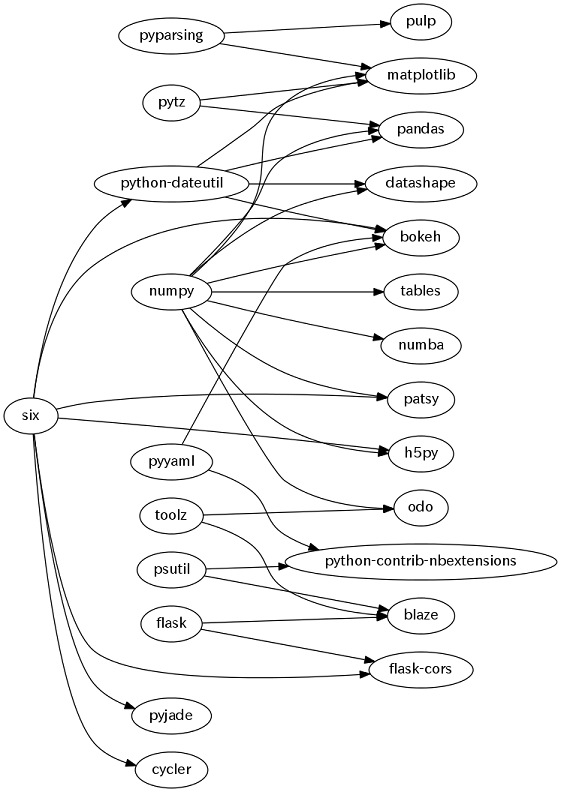
以下のようにして python-dep.pngを作成できます。
左からインストールしていけば よいように、並んでいます。
python
import graphviz
from subprocess import run, DEVNULL, PIPE
ss = run(['pipdeptree'], stdout=DEVNULL, stderr=PIPE,
         universal_newlines=True).stderr.rstrip().split('\n')
ss = [s[2:].lower().split()[:3] for s in ss if s[0] in ' *']
g = graphviz.Digraph(format='png', filename='python-dep', engine='dot')
g.edges([(s[2], s[0][:s[0].index('=')]) for s in ss])
g.attr('graph', rankdir='LR')
g.render()
Dockerでお試し
上記の一連のdocker(Dockerfile)を用意しました。下記のようにして、python-dep.pngを作成できます。
bash
docker run -it --rm -v $PWD:/tmp -w /tmp \
    tsutomu7/python-dep python /root/python-dep.py
参考
Graphvizとdot言語でグラフを描く方法のまとめ
pip関連ツールでPythonのパッケージ管理を楽にする
Python にインストールしたパッケージをグラフにしてみた ... 記事を書いた後、見つけました。
以上