0
1

Delete article

Deleted articles cannot be recovered.

Draft of this article would be also deleted.

Are you sure you want to delete this article?

More than 5 years have passed since last update.

R > ( オブジェクトxのデータ数を数える > length(x) ) / ( length(x)に基づきplot()する > plot(1:length(x),x) > plot(x)で良かった)

Last updated at Posted at 2016-09-11
動作環境
RStudio 0.99.903 on Windows 7 pro
R version 3.3.1 

データ数の取得

xtmp<-read.table("excel1650.csv")
x<-xtmp$V1

としてxを読込んだとする。

そのxのデータ数を確認したい。

> length(x)
[1] 721

plot

上記を調べた理由としては、読込んだデータセットの幅いっぱいにplotしたかった。

length(x)によりデータ数が取得できるので、以下でいい。

> x<-xtmp$V1
> plot(1:length(x),x)

qiita.png

v0.2

@r-de-r さんのコメントplot(x)だけでよいことを知りました。

情報感謝です。

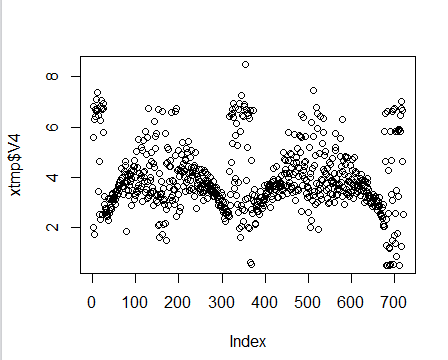
plot(x)の場合は、横軸は「Index」というのが付くようです。

下記は違うデータでのプロット例。

qiita.png

0
1
1

Register as a new user and use Qiita more conveniently

  1. You get articles that match your needs
  2. You can efficiently read back useful information
  3. You can use dark theme
What you can do with signing up
0
1

Delete article

Deleted articles cannot be recovered.

Draft of this article would be also deleted.

Are you sure you want to delete this article?