動作環境
GeForce GTX 1070 (8GB)
ASRock Z170M Pro4S [Intel Z170chipset]
Ubuntu 16.04 LTS desktop amd64
TensorFlow v1.1.0
cuDNN v5.1 for Linux
CUDA v8.0
Python 3.5.2
IPython 6.0.0 -- An enhanced Interactive Python.
gcc (Ubuntu 5.4.0-6ubuntu1~16.04.4) 5.4.0 20160609
GNU bash, version 4.3.48(1)-release (x86_64-pc-linux-gnu)
http://qiita.com/7of9/items/02313f11d2917ed2b040
にて使用したファイル
- 学習元ファイル
- 学習結果ファイル
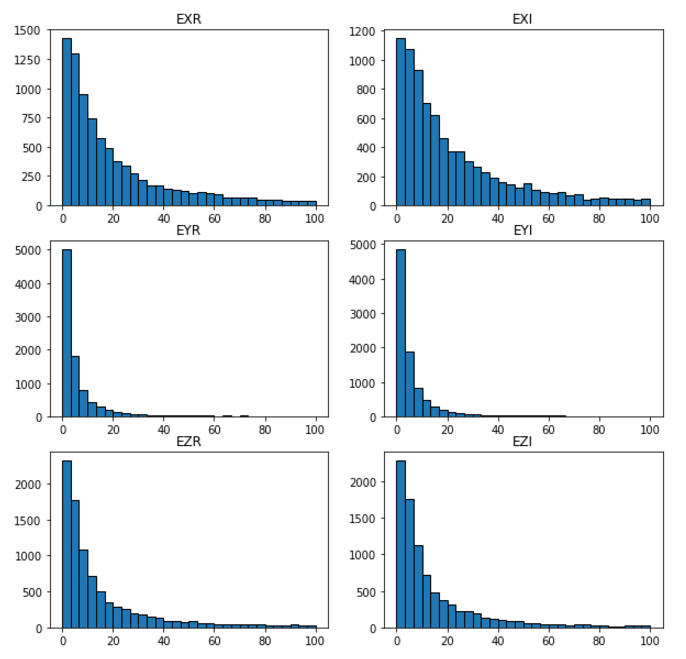
相対誤差のヒストグラムを作ってみた。
code
Jupyter code.
histogram_relErr_170807.ipynb
% matplotlib inline
import numpy as np
import matplotlib.pyplot as plt

FILE_ANSWER = 'LN-IntField-Y.in'
FILE_PREDICTION = 'IntField-Y.out_170729'


def calc_relativeError(ans, prd):
    err = (ans - prd) / ans
    err = np.absolute(err) * 100  # [%]
    return err


def get_list_err(idx):
    dstlist = np.array([])
    ans = np.genfromtxt(FILE_ANSWER, delimiter=' ', skip_header=2)
    prd = np.genfromtxt(FILE_PREDICTION, delimiter=' ', skip_header=2)
    for answer, prediction in zip(ans, prd):
        exr_a = answer[idx]
        exr_p = prediction[idx]
        err = calc_relativeError(exr_a, exr_p)
        dstlist = np.append(dstlist, err)
    return dstlist


def draw_graph(fig, readIdx, locIdx, label):
    ax1 = fig.add_subplot(3, 2, locIdx)
    elist = get_list_err(readIdx)
    ax1.hist(elist, bins=30, ec='black', range=(0.0, 100.0))
    ax1.set_title(label)

# x y z |E|^2 Ex.r Ex.i Ey.r Ey.i Ez.r Ez.i
IDX_EXR, IDX_EXI = 4, 5
IDX_EYR, IDX_EYI = 6, 7
IDX_EZR, IDX_EZI = 8, 9

fig = plt.figure(figsize=(10, 10))
draw_graph(fig, readIdx=IDX_EXR, locIdx=1, label='EXR')
draw_graph(fig, readIdx=IDX_EXI, locIdx=2, label='EXI')
draw_graph(fig, readIdx=IDX_EYR, locIdx=3, label='EYR')
draw_graph(fig, readIdx=IDX_EYI, locIdx=4, label='EYI')
draw_graph(fig, readIdx=IDX_EZR, locIdx=5, label='EZR')
draw_graph(fig, readIdx=IDX_EZI, locIdx=6, label='EZI')
結果
参考
matplotlibのヒストグラムで分割線を表示
http://qiita.com/KYhei/items/cde00bf31bb0c9c18260
[Python]Matplotlibでヒストグラムを描画する方法
http://qiita.com/supersaiakujin/items/be4a78809e7278c065e6
