動作環境
GeForce GTX 1070 (8GB)
ASRock Z170M Pro4S [Intel Z170chipset]
Ubuntu 16.04 LTS desktop amd64
TensorFlow v1.1.0
cuDNN v5.1 for Linux
CUDA v8.0
Python 3.5.2
IPython 6.0.0 -- An enhanced Interactive Python.
gcc (Ubuntu 5.4.0-6ubuntu1~16.04.4) 5.4.0 20160609
GNU bash, version 4.3.48(1)-release (x86_64-pc-linux-gnu)
@ Python機械学習プログラミング by Sebestian Raschkaら
p.38
本書に登場する機械学習のさまざまなアルゴリズムは、最適なパフォーマンスを実現するにあたって何らかの特徴量のスケーリングを必要とする。(中略) ここでは、標準化(standardization)というスケーリング手法を用いる。このスケーリング手法はデータに標準正規分布の特性を与える。その特性とは、各特徴量の平均を0として、標準偏差を1にするというものだ。(後略)
式 (2.5.6)
x'_j = \frac{x_j - \mu_j}{\sigma_j}
試してみた
関連: Matplotlib > Link > youtube動画 > Introduction to NumPy | SciPy 2015 Tutorial | Eric Jones
上記でscatter()の例があったので、それを元にする。
Jupyter code.
DataStandardization_170812.ipynb
%matplotlib inline
import numpy as np
import matplotlib.pyplot as plt
def normalize_data(x,y):
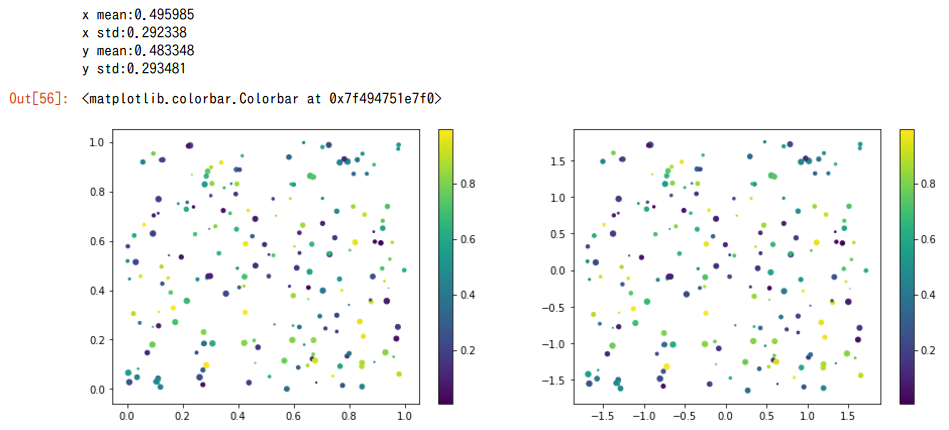
print('x mean:%f' % x.mean())
print('x std:%f' % x.std())
print('y mean:%f' % y.mean())
print('y std:%f' % y.std())
x = (x - x.mean()) / x.std()
y = (y - y.mean()) / y.std()
return x, y
xorg = np.random.rand(200)
yorg = np.random.rand(200)
size = np.random.rand(200) * 30
color = np.random.rand(200)
xnrm, ynrm = normalize_data(xorg, yorg)
fig = plt.figure(figsize=(15,5))
fig.clf()
ax1 = fig.add_subplot(1, 2, 1)
cax1 = ax1.scatter(xorg, yorg, size, color)
plt.colorbar(cax1)
ax2 = fig.add_subplot(1, 2, 2)
cax2 = ax2.scatter(xnrm, ynrm, size, color)
plt.colorbar(cax2)
補足 > Error:AttributeError while adding colorbar in matplotlib
ax1.colorbar()とするとエラーがでた。
https://stackoverflow.com/questions/2643953/attributeerror-while-adding-colorbar-in-matplotlib
に記載のコードを参照して、上記のように実装した。