TensorFlow
動作環境
GeForce GTX 1070 (8GB)
ASRock Z170M Pro4S [Intel Z170chipset]
Ubuntu 14.04 LTS desktop amd64
TensorFlow v0.11
cuDNN v5.1 for Linux
CUDA v8.0
Python 2.7.6
IPython 5.1.0 -- An enhanced Interactive Python.
gcc (Ubuntu 4.8.4-2ubuntu1~14.04.3) 4.8.4
v0.1 http://qiita.com/7of9/items/8b43357bcaea1f1bce4b
2つの画像を横に並べて表示しようとしている。
前回 http://qiita.com/7of9/items/68da222129dc657eac54
参考 http://qiita.com/supersaiakujin/items/543053ca4610437112df
2つの方法を試してみた。
- 方法1. 各画像に対してplt.subplot()をコールしてからplt.imshow()
- 方法2. 最初にplt.subplots(ncols=2)をコールしておく
code
以下において、
showIn2D_2image_subplot_each()が方法1。
showIn2D_2image_subplot_first()が方法2。
in100_out100.ipynb
import numpy as np
import matplotlib.pyplot as plt
import matplotlib.cm as cm

'''
v0.3 Jan. 21, 2017
  - show 2 images in one figure
v0.2 Jan. 14, 2017
  - calcOutput() return in numpy.array
  - add saveToCsvFile()
v0.1 Jan. 14, 2017
  - add calcOutput()
  - add showIn2D()
  - show 1d in 2d format
'''

XDIM = 10
YDIM = 10
INDIM = XDIM * YDIM


def saveToCsvFile(data_1d, filename):
    wrk_1d = data_1d.reshape(1,INDIM)
    np.savetxt(filename, wrk_1d, delimiter=',')


def calcOutput(in_1d):
    len_1d = XDIM * YDIM
    out_1d = [0.0] * len_1d
    for idx in range(0, in_1d.size):
        out_1d[idx] = in_1d[len_1d - idx - 1]
    return np.array(out_1d)


def showIn2D(data_1d):
    # print(data_1d)
    data_2d = np.reshape(data_1d, (XDIM, YDIM))
    plt.imshow(data_2d, extent=(0, XDIM, 0, YDIM), cmap=cm.gist_rainbow)
    plt.show()

def showIn2D_2image_subplot_each(data1_1d, data2_1d):
    data1_2d = np.reshape(data1_1d, (XDIM, YDIM))
    data2_2d = np.reshape(data2_1d, (XDIM, YDIM))
    fig1 = plt.figure(1)
    plt.subplot(121)
    plt.title('input node')
    plt.imshow(data1_2d, extent=(0, XDIM, 0, YDIM), cmap=cm.gist_rainbow)
    plt.subplot(122)
    plt.title('output node')
    plt.imshow(data2_2d, extent=(0, XDIM, 0, YDIM), cmap=cm.gist_rainbow)
    plt.show()

def showIn2D_2image_subplot_first(data1_1d, data2_1d):
    data1_2d = np.reshape(data1_1d, (XDIM, YDIM))
    data2_2d = np.reshape(data2_1d, (XDIM, YDIM))
    fig, (axL, axR) = plt.subplots(ncols=2, figsize=(10,4))
    axL.imshow(data1_2d, extent=(0, XDIM, 0, YDIM), cmap=cm.gist_rainbow)
    axL.grid(True)
    axR.imshow(data2_2d, extent=(0, XDIM, 0, YDIM), cmap=cm.gist_rainbow)
    axR.grid(True)
    fig.show()

if __name__ == '__main__':
    in_1d = np.random.rand(INDIM)
    # showIn2D(in_1d)
    out_1d = calcOutput(in_1d)
    # showIn2D(out_1d)

    showIn2D_2image_subplot_each(in_1d, out_1d)
    showIn2D_2image_subplot_first(in_1d, out_1d)

    saveToCsvFile(in_1d, 'test_in.csv')
    saveToCsvFile(out_1d, 'test_out.csv')
結果
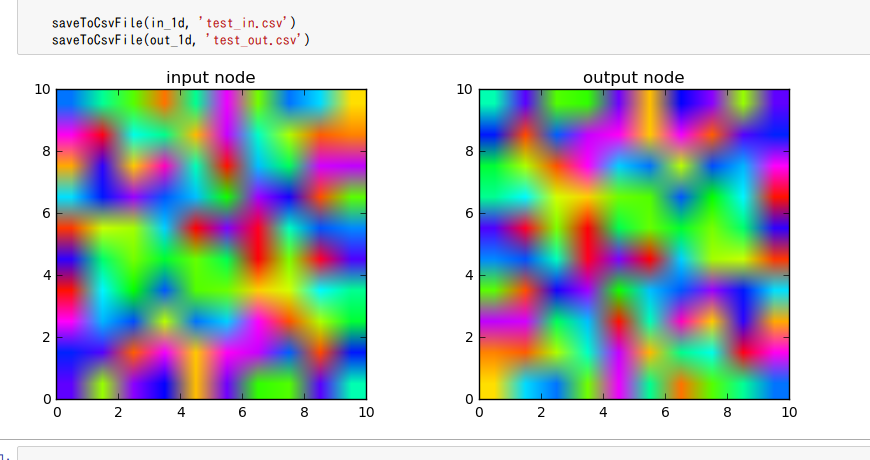
方法1の結果は表示され、方法2の結果は表示されなかった。