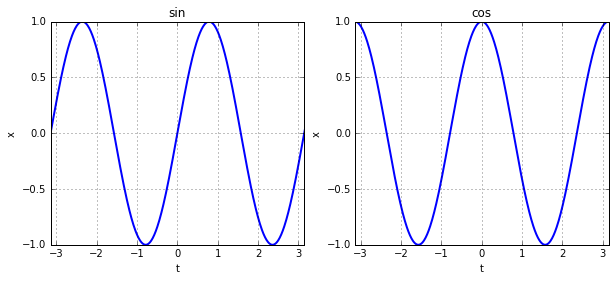
左右に2つのグラフを表示する。
import matplotlib.pyplot as plt
import numpy as np

t = np.linspace(-np.pi, np.pi, 1000)

x1 = np.sin(2*t)
x2 = np.cos(2*t)

fig, (axL, axR) = plt.subplots(ncols=2, figsize=(10,4))

axL.plot(t, x1, linewidth=2)
axL.set_title('sin')
axL.set_xlabel('t')
axL.set_ylabel('x')
axL.set_xlim(-np.pi, np.pi)
axL.grid(True)

axR.plot(t, x2, linewidth=2)
axR.set_title('cos')
axR.set_xlabel('t')
axR.set_ylabel('x')
axR.set_xlim(-np.pi, np.pi)
axR.grid(True)

fig.show()

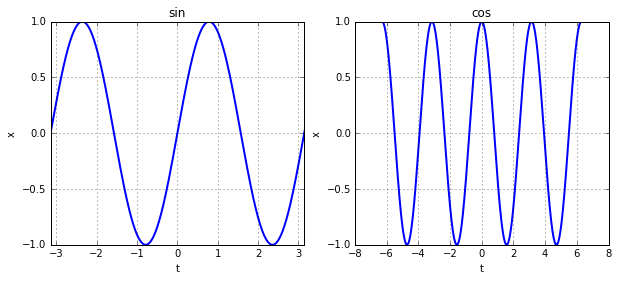
軸のShare
複数のグラフを表示するときに、X軸の設定をすべてのグラフで設定するのが面倒な時にShareが使えます。subplotsに引数でsharex=Trueとするだけです。あい
share あり
import matplotlib.pyplot as plt
import numpy as np

t = np.linspace(-np.pi*2, np.pi*2, 1000)

x1 = np.sin(2*t)
x2 = np.cos(2*t)

fig, (axL, axR) = plt.subplots(ncols=2, figsize=(10,4), sharex=True)

axL.plot(t, x1, linewidth=2)
axL.set_title('sin')
axL.set_xlabel('t')
axL.set_ylabel('x')
axL.set_xlim(-np.pi, np.pi)
axL.grid(True)

axR.plot(t, x2, linewidth=2)
axR.set_title('cos')
axR.set_xlabel('t')
axR.set_ylabel('x')
axR.grid(True)

fig.show()
share なし
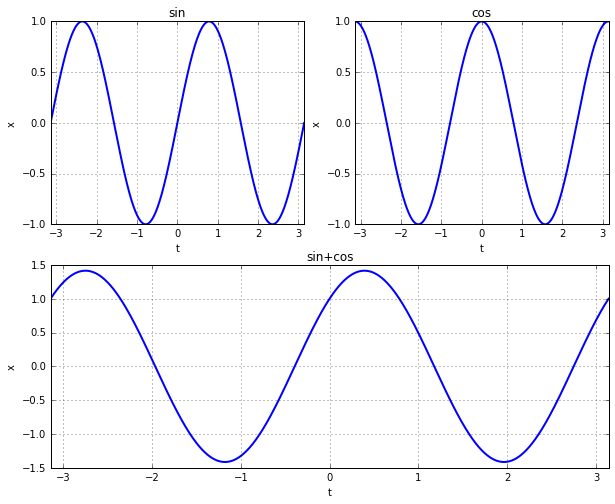
ちょっと複雑な配置にする。
一列目は普通に2つのグラフを表示し、2列目は全部つかって長いグラフを表示したい時は、下記のようにsubplot2gridを使う方法がある。
import matplotlib.pyplot as plt
import numpy as np

t = np.linspace(-np.pi, np.pi, 1000)

x1 = np.sin(2*t)
x2 = np.cos(2*t)
x3 = x1 + x2

fig = plt.figure(figsize=(10,8))
ax1 = plt.subplot2grid((2,2), (0,0))
ax2 = plt.subplot2grid((2,2), (0,1))
ax3 = plt.subplot2grid((2,2), (1,0), colspan=2)

ax1.plot(t, x1, linewidth=2)
ax1.set_title('sin')
ax1.set_xlabel('t')
ax1.set_ylabel('x')
ax1.set_xlim(-np.pi, np.pi)
ax1.grid(True)

ax2.plot(t, x2, linewidth=2)
ax2.set_title('cos')
ax2.set_xlabel('t')
ax2.set_ylabel('x')
ax2.set_xlim(-np.pi, np.pi)
ax2.grid(True)

ax3.plot(t, x3, linewidth=2)
ax3.set_title('sin+cos')
ax3.set_xlabel('t')
ax3.set_ylabel('x')
ax3.set_xlim(-np.pi, np.pi)
ax3.grid(True)

fig.show()
その他にもmatplotlib.gridspecを使用する方法もある。
この場合はgridspec.Gridspec(xxx,yyy)で得られた2次元配列の使用した箇所を指定してsubplotの引数にする。
例えば、左の一番上を使用したい場合は、
gs = gridspec.GridSpec(2,2)
ax1 = plt.subplot(gs[0,0])
となる。
また、1列目を全部遣いたい場合は、
ax2 = plt.subplot(gs[1,:])
となる。
import matplotlib.pyplot as plt
import matplotlib.gridspec as gridspec
import numpy as np

t = np.linspace(-np.pi, np.pi, 1000)

x1 = np.sin(2*t)
x2 = np.cos(2*t)
x3 = x1 + x2

fig = plt.figure(figsize=(10,8))
gs = gridspec.GridSpec(2,2)

ax1 = plt.subplot(gs[0,0])
ax2 = plt.subplot(gs[0,1])
ax3 = plt.subplot(gs[1,:])

ax1.plot(t, x1, linewidth=2)
ax1.set_title('sin')
ax1.set_xlabel('t')
ax1.set_ylabel('x')
ax1.set_xlim(-np.pi, np.pi)
ax1.grid(True)

ax2.plot(t, x2, linewidth=2)
ax2.set_title('cos')
ax2.set_xlabel('t')
ax2.set_ylabel('x')
ax2.set_xlim(-np.pi, np.pi)
ax2.grid(True)

ax3.plot(t, x3, linewidth=2)
ax3.set_title('sin+cos')
ax3.set_xlabel('t')
ax3.set_ylabel('x')
ax3.set_xlim(-np.pi, np.pi)
ax3.grid(True)

fig.show()
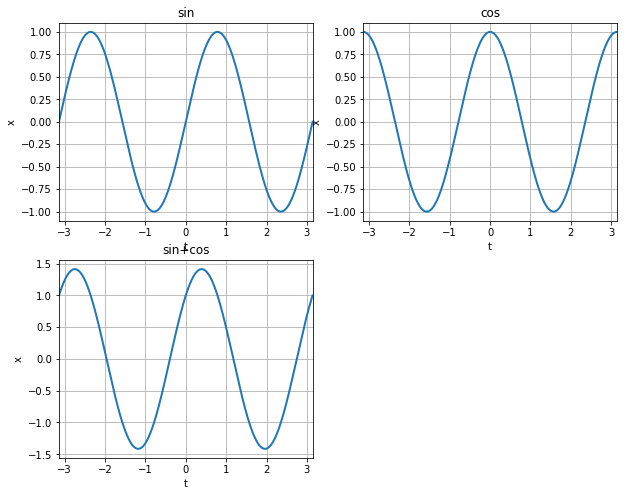
subplotsで空欄をつくる
subplotsで作成した枠に対してグラフが少ない場合は、描画したくない領域に対してaxis('off')をする。
import matplotlib.pyplot as plt
import numpy as np

t = np.linspace(-np.pi, np.pi, 1000)


x1 = np.sin(2*t)
x2 = np.cos(2*t)
x3 = x1 + x2

fig,axes = plt.subplots(nrows=2,ncols=2,figsize=(10,8))


axes[0,0].plot(t, x1, linewidth=2)
axes[0,0].set_title('sin')
axes[0,0].set_xlabel('t')
axes[0,0].set_ylabel('x')
axes[0,0].set_xlim(-np.pi, np.pi)
axes[0,0].grid(True)

axes[0,1].plot(t, x2, linewidth=2)
axes[0,1].set_title('cos')
axes[0,1].set_xlabel('t')
axes[0,1].set_ylabel('x')
axes[0,1].set_xlim(-np.pi, np.pi)
axes[0,1].grid(True)

axes[1,0].plot(t, x3, linewidth=2)
axes[1,0].set_title('sin+cos')
axes[1,0].set_xlabel('t')
axes[1,0].set_ylabel('x')
axes[1,0].set_xlim(-np.pi, np.pi)
axes[1,0].grid(True)

axes[1,1].axis('off')
下記を参考にした
http://matplotlib.org/examples/pylab_examples/subplots_demo.html
http://matplotlib.org/users/recipes.html