動作環境
GeForce GTX 1070 (8GB)
ASRock Z170M Pro4S [Intel Z170chipset]
Ubuntu 16.04 LTS desktop amd64
TensorFlow v1.1.0
cuDNN v5.1 for Linux
CUDA v8.0
Python 3.5.2
IPython 6.0.0 -- An enhanced Interactive Python.
gcc (Ubuntu 5.4.0-6ubuntu1~16.04.4) 5.4.0 20160609
GNU bash, version 4.3.48(1)-release (x86_64-pc-linux-gnu)
TensorFlow > sine curveの学習 > TensorFlowコードでpredictionをグラフ化してみた > sine curveになっていなかった > sine curveになった ( 誤差:0.01以下)
のTFRecords版を実装することで、使い方を学ぶ。
v0.1: http://qiita.com/7of9/items/ab27432caedbfb301650
前回: http://qiita.com/7of9/items/be67c849f4d662cc26f9
v0.6
学習結果確認用にpredictionをprintするようにした。
TFRecordsファイル生成
学習コード v0.6
learn_sineCurve_170708.py
import numpy as np
import tensorflow as tf
import tensorflow.contrib.slim as slim

"""
v0.6 Jul. 09, 2017
  - modify for PEP8
  - print prediction after learning
v0.5 Jul. 09, 2017
  - fix bug > [Attempting to use uninitialized value hidden/hidden_1/weights]
v0.4 Jul. 09, 2017
  - fix bug > stops only for one epoch
    + set [num_epochs=None] for string_input_producer()
  - change parameters for shuffle_batch()
  - implement training
v0.3 Jul. 09, 2017
  - fix warning > use tf.local_variables_initializer() instead of
       initialize_local_variables()
  - fix warning > use tf.global_variables_initializer() instead of
       initialize_all_variables()
v0.2 Jul. 08, 2017
  - fix bug > OutOfRangeError (current size 0)
    + use [tf.initialize_local_variables()]
v0.1 Jul. 08, 2017
  - only read [.tfrecords]
    + add inputs_xy()
    + add read_and_decode()
"""

# codingrule: PEP8

IN_FILE = 'input_170708.tfrecords'


def read_and_decode(filename_queue):
    reader = tf.TFRecordReader()
    _, serialized_example = reader.read(filename_queue)
    features = tf.parse_single_example(
        serialized_example,
        features={
           'x_raw': tf.FixedLenFeature([], tf.string),
           'y_raw': tf.FixedLenFeature([], tf.string),
        })
    x_raw = tf.decode_raw(features['x_raw'], tf.float32)
    y_raw = tf.decode_raw(features['y_raw'], tf.float32)

    x_org = tf.reshape(x_raw, [1])
    y_org = tf.reshape(y_raw, [1])

    return x_org, y_org


def inputs_xy():
    filename = IN_FILE
    filequeue = tf.train.string_input_producer(
        [filename], num_epochs=None)

    x_org, y_org = read_and_decode(filequeue)
    return x_org, y_org

x_orgs, y_orgs = inputs_xy()
batch_size = 4  # 4
x_batch, y_batch = tf.train.shuffle_batch([x_orgs, y_orgs],
                                          batch_size,
                                          capacity=40,
                                          min_after_dequeue=batch_size)

input_ph = tf.placeholder("float", [None, 1])
output_ph = tf.placeholder("float", [None, 1])

# network
hiddens = slim.stack(input_ph, slim.fully_connected, [7, 7, 7],
                     activation_fn=tf.nn.sigmoid, scope="hidden")
# prediction = slim.fully_connected(hiddens, 1,
#                                   activation_fn=tf.nn.sigmoid,
#                                   scope="output")
prediction = slim.fully_connected(hiddens, 1,
                                  activation_fn=None, scope="output")
loss = tf.contrib.losses.mean_squared_error(prediction, output_ph)

train_op = slim.learning.create_train_op(loss, tf.train.AdamOptimizer(0.001))

init_op = [tf.global_variables_initializer(), tf.local_variables_initializer()]

with tf.Session() as sess:
    sess.run(init_op)
    coord = tf.train.Coordinator()
    threads = tf.train.start_queue_runners(sess=sess, coord=coord)

    try:
        for idx in range(30000):
            inpbt, outbt = sess.run([x_batch, y_batch])
            _, t_loss = sess.run([train_op, loss],
                                 feed_dict={input_ph: inpbt, output_ph: outbt})
            if (idx + 1) % 100 == 0:
                print("%d,%f" % (idx+1, t_loss))
    finally:
        coord.request_stop()

    # output trained curve
    print('output')  # used to separate from above lines with grep
    for loop in range(10):
        inpbt, outbt = sess.run([x_batch, y_batch])
        pred = sess.run([prediction],
                        feed_dict={input_ph: inpbt, output_ph: outbt})
        for din, dout in zip(inpbt, pred[0]):
            print('%.5f,%.5f' % (din, dout))

    coord.join(threads)
実行
$ python3 learn_sineCurve_170708.py pwd > res.170709_0900.org
上記の出力からpredictionの出力だけ取得する
$ grep -A 200 output res.170709_0900.org | grep -v output > res.170709_0900.cut
結果確認
Jupyter + Matplotlibコード
showSineCurveResult_170708.ipynb
%matplotlib inline

# sine curve learning
# Jul. 08, 2017

import numpy as np
import matplotlib.pyplot as plt

data1 = np.loadtxt('input.csv', delimiter=',')
# data2 = np.loadtxt('res.170708_0830.cut', delimiter=',')
data2 = np.loadtxt('res.170709_0900.cut', delimiter=',')

input1 = data1[:,0]
output1 = data1[:,1]
input2 = data2[:,0]
output2 = data2[:,1]

fig = plt.figure()
ax1 = fig.add_subplot(2,1,1)
ax2 = fig.add_subplot(2,1,2)

ax1.scatter(input1,output1)
ax2.scatter(input2,output2)

ax1.set_xlabel('x')
ax1.set_ylabel('sin(x)')
ax1.set_xlim([0,1.0])
ax1.grid(True)

ax2.set_xlabel('x')
ax2.set_ylabel('sin(x)')
ax2.set_xlim([0,1.0])
ax2.grid(True)

fig.show()
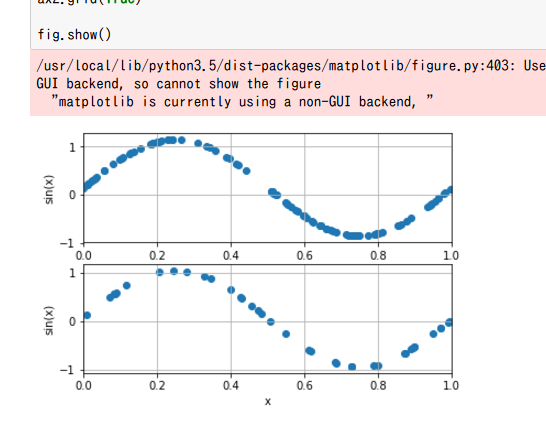
下の図がprediction。sine curveになっている。
上の図は今回関係していないinput.csvファイルの図。
だいたいの使い方は学べたかと思う。
(補足: MatplotlibのWarningはfig.show()を消せば解消する: link)
補足
下記は必要になった時に学ぶことになるだろう。
- 100万セットのサンプルを使う知見は未消化
- TFRecordsファイルの分け方など
- 【Tensorflow】TFRecordファイルでshuffle_batchしたときの偏り調査 by ykiciskさん
- 複数スレッドに関する処理についても未消化