概要
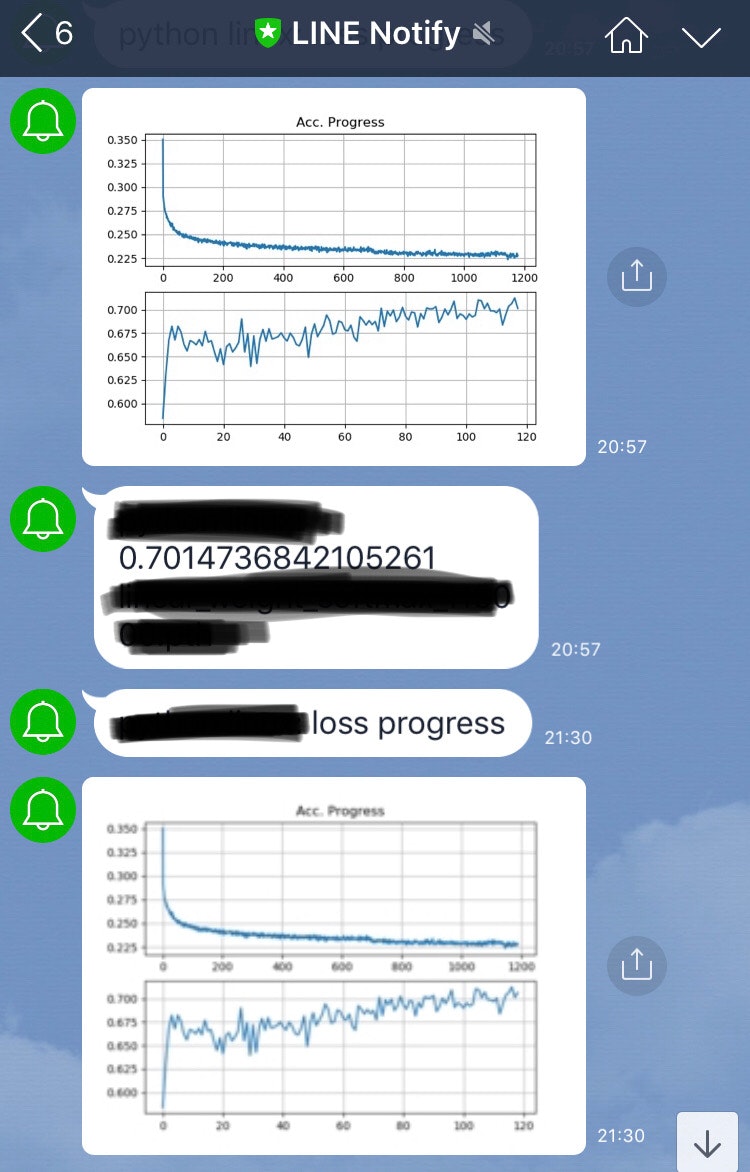
- 何らかの理由で計算機から離れざるを得ないときに、学習の経過をグラフィカルに通知してくれるツールをこしらえた
- 動作例:
環境
- マシン:Ubuntu 18.04 LTS
- Python: Python 3.6.x
通知用のモジュール
コード
import subprocess as sp

def send_image(path_to_img, message = "notification"):
    line_notify_token = "xxxxxxxxxxxxxxxxxxxxxxxxxxxxxxxxxxxxxxx"
    line_notify_api = 'https://notify-api.line.me/api/notify'
    sp.getoutput(
        "curl -X POST {} -H 'Authorization: Bearer {}' -F 'message={}' -F 'imageFile=@{}'".format(line_notify_api, line_notify_token, m, path_to_img))
使用法
send_image(path_to_img, message)
LINE Notify APIを利用して、引数で指定されたパスの画像と任意の文字列を送信する
-
path_to_img(string):画像へのパス。無意味なパスを指定したり送信に失敗すると、次の引数であるmessageのみが通知される。 -
message(string):画像とともに送信するメッセージ
Note
line_notify_tokenはLINE Notify APIのアクセストークンで、自分自身のものを取得する必要があります。アクセストークンの取得方法はこちらなどを参照してください。
使用例(擬似的なコード)
import matplotlib.pyplot as plt

def make_prog_image(loss_progress, acc_progress, path_to_img = "./notify_img.png"):
    """
    lossとaccuracyの推移を二段組のグラフに描画し、指定されたパスに保存する
    """
    fig, (axU, axD) = plt.subplots(2, 1)

    axU.plot(loss_progress)
    axU.grid(True)
    axU.set_title('Loss Progress')

    axD.plot(acc_progress)
    axD.grid(True)
    axD.set_title('Acc. Progress')

    fig.savefig(path_to_img)

for epoch in range(epochs)
    ~ 何らかの処理 ~
    loss_progress = []
    acc_progress = []

    for iter in range(iters):
        ~ 何らかの処理 ~
        loss = classification_loss(train_data, target)
        acc = get_accuracy()

        loss_progress.append(loss)
        acc_progress.append(acc)

    path_to_img = "path/to/img"

    make_prog_image(loss_progress, acc_progress, path_to_img)
    send_img(path_to_img, message = "loss progress")
結果
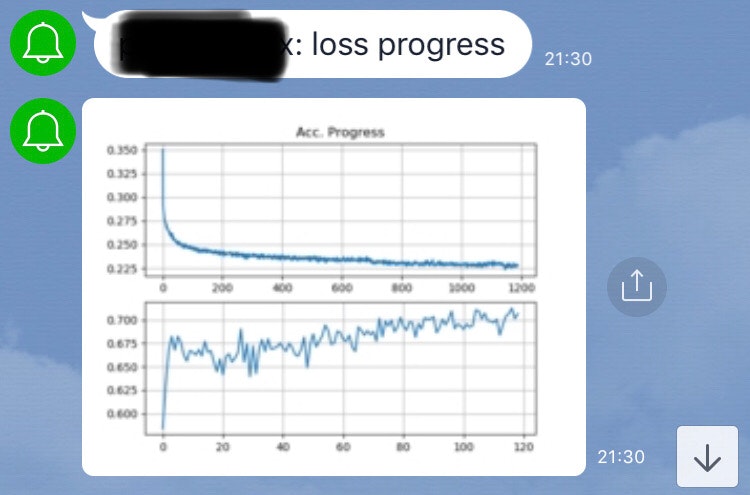
Seems fine ![]()