使用したもの
Mathematica 11
目標
目標はMathematica を使って意図した通りにグラフを描くことです。自分用の備忘録のつもりなので、ヘルプドキュメント内を探し回ってもなかなか見つからなかったものについてだけ書きます。
2次元のグラフを描く
Plot
例題
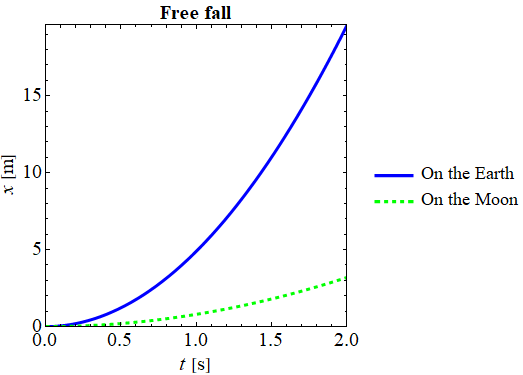
自由落下する物体の時間t に対する変位x のグラフを描きます。
出力
画像のように出力します。
入力
先の図を出力するための入力内容です。
f[t_] = (9.8/2)*t^2;(*Free fall on the Earth*)
g[t_] = (1.6/2)*t^2;(*Free fall on the Moon*)

Plot[{f[t], g[t]}, {t, 0, 2},
 PlotLegends ->
  Placed[{Style["On the Earth", FontSize -> 18, Black,
     FontFamily -> "Times New Roman"],
    Style["On the Moon", FontSize -> 18, Black,
     FontFamily -> "Times New Roman"]}, Right],
 PlotStyle -> {Directive[Blue, Thickness[0.01]], {Green,
    Thickness[0.01], Dashed}},
 PlotRange -> {{0, 2}, {f[0], f[2]}},
 PlotLabel ->
  Style["Free fall", Bold, FontSize -> 20, Black,
   FontFamily -> "Times New Roman"],
 AspectRatio -> 1,
 Frame -> True,
 FrameStyle -> Directive[Black],
 FrameLabel -> {Row[{Style["t", Italic, FontSize -> 20, Black,
      FontFamily -> "Times New Roman"],
     Style[" [s]", FontSize -> 20, Black,
      FontFamily -> "Times New Roman"]}],
   Row[{Style["x", Italic, FontSize -> 20, Black,
      FontFamily -> "Times New Roman"],
     Style[" [m]", FontSize -> 20, Black,
      FontFamily -> "Times New Roman"]}]},
 FrameTicksStyle ->
  Directive[Black, FontSize -> 20,  FontFamily -> "Times New Roman"],
 ImageSize -> Medium]
入力の説明
Row 関数
リストを渡すと、それを横に並べてくれる関数のようです。FrameLabel の部分で使用しています。この関数を使わずにStyle[] を並べるだけだと[m]x のように単位と変数が逆転してしまったので、それを回避するために使用しました。
その他に気を付けたこと
Plot のデフォルトのままだとラベル等の文字色がグレーになっていたので、各所でBlack の指定を入れています。