http://qiita.com/hoxo_m/items/5ca984d9dcac16090223
こちらの投稿を参考にしてPython, Juyterでもやってみました。
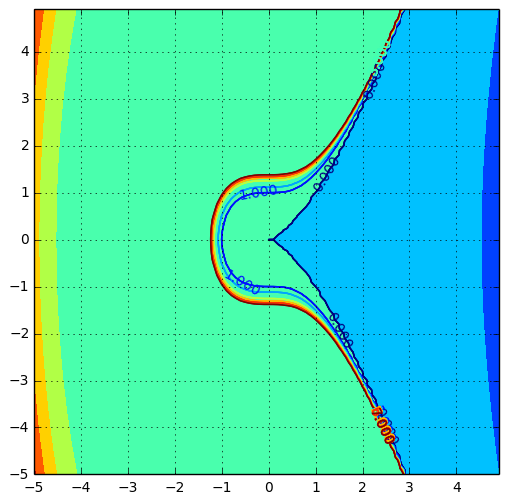
スライドバーを動かすと異なるパラメータの曲線がプロットされます。
ipywidgetsをインストールしてやってみてください。
import numpy as np
import pylab as plt
import matplotlib.cm as cm
%pylab inline
from ipywidgets import  interact


N=5
delta=0.1
xs= np.arange(-N, N, delta)
ys = np.arange(-N, N, delta)
X, Y = np.meshgrid(xs, ys)

def fmesh(f,xs,ys):
    return [[f(x,y)for x in xs] for y in ys]

@interact(a=(-10, 10, 2),index=(1,5,1))
def plot(a,index):
    f=lambda x,y: (y**2-(x + a)*x**2)**index
    plt.figure(figsize=(6,6))
    ticks=range(-5,5)
    plt.xticks(ticks)
    plt.yticks(ticks)
    interval = [i/4  for i in range(30)]
    CS=plt.contour(X, Y, fmesh(f,xs,xs),interval)
    plt.clabel(CS, inline=0, fontsize=10)
    plt.contourf(X,Y, fmesh(f,xs,xs))
    plt.grid()
参考
http://qiita.com/y__sama/items/654ed8ab7464718876f9
http://qiita.com/tanemaki/items/e965cd9c25acbeed860c