Filebeatのapache2モジュールを使用してアクセスログを取り込んだが、デフォルトではレスポンスタイムは取り込まれていないようだったので、取り込むよう対応してみた。
とりあえずメモです。
インストール
Elasticsearch、Kibana、Filebeatインストール用のリポジトリを配置。
[elasticsearch-6.x]
name=Elasticsearch repository for 6.x packages
baseurl=https://artifacts.elastic.co/packages/6.x/yum
gpgcheck=1
gpgkey=https://artifacts.elastic.co/GPG-KEY-elasticsearch
enabled=1
autorefresh=1
type=rpm-md
下記のものをインストール。
yum install -y java-1.8.0-openjdk-devel elasticsearch kibana filebeat httpd
Elasticsearchの設定
外部から接続できるよう設定し、Elasticsearchを起動する。
/etc/elasticsearch/elasticsearch.yml
- #network.host: 192.168.0.1
+  network.host: 0.0.0.0
[root@es ~]# systemctl restart elasticsearch
[root@es ~]# curl http://127.0.0.1:9200
{
  "name" : "4FH6KEs",
  "cluster_name" : "elasticsearch",
  "cluster_uuid" : "HTHEBXGFQlO4TzABbjuvCg",
  "version" : {
    "number" : "6.3.1",
    "build_flavor" : "default",
    "build_type" : "rpm",
    "build_hash" : "eb782d0",
    "build_date" : "2018-06-29T21:59:26.107521Z",
    "build_snapshot" : false,
    "lucene_version" : "7.3.1",
    "minimum_wire_compatibility_version" : "5.6.0",
    "minimum_index_compatibility_version" : "5.0.0"
  },
  "tagline" : "You Know, for Search"
}
Filebeatで必要になるElasticsearchのプラグインをインストール。
[root@es ~]# /usr/share/elasticsearch/bin/elasticsearch-plugin install ingest-user-agent
[root@es ~]# /usr/share/elasticsearch/bin/elasticsearch-plugin install ingest-geoip
[root@es ~]# systemctl restart elasticsearch
Kibanaの設定
外部から接続できるよう設定し、Kibanaを起動する。
/etc/kibana/kibana.yml
# Kibana is served by a back end server. This setting specifies the port to use.
- #server.port: 5601
+  server.port: 5601

# Specifies the address to which the Kibana server will bind. IP addresses and host names are both valid values.
# The default is 'localhost', which usually means remote machines will not be able to connect.
# To allow connections from remote users, set this parameter to a non-loopback address.
- #server.host: "localhost"
+  server.host: "0.0.0.0"
[root@es ~]# systemctl restart kibana
[root@es ~]# curl http://127.0.0.1:5601
<script>var hashRoute = '/app/kibana';
var defaultRoute = '/app/kibana';

var hash = window.location.hash;
if (hash.length) {
  window.location = hashRoute + hash;
} else {
  window.location = defaultRoute;
}</script>
Apacheの設定
アクセスログにレスポンスタイム(マイクロ秒)を出力させるよう設定し、httpdを起動させる。
<IfModule log_config_module>
    #
    # The following directives define some format nicknames for use with
    # a CustomLog directive (see below).
    #
-   LogFormat "%h %l %u %t \"%r\" %>s %b \"%{Referer}i\" \"%{User-Agent}i\"" combined
+   LogFormat "%h %l %u %t \"%r\" %>s %b \"%{Referer}i\" \"%{User-Agent}i\" %D" combined
    LogFormat "%h %l %u %t \"%r\" %>s %b" common

    <IfModule logio_module>
      # You need to enable mod_logio.c to use %I and %O
      LogFormat "%h %l %u %t \"%r\" %>s %b \"%{Referer}i\" \"%{User-Agent}i\" %I %O" combinedio
    </IfModule>
[root@es ~]# systemctl restart httpd
[root@es ~]# curl http://127.0.0.1
[root@es ~]# tail /var/log/httpd/access_log
127.0.0.1 - - [13/Jul/2018:13:28:53 +0000] "GET / HTTP/1.1" 403 4897 "-" "curl/7.29.0" 534
Filebeatの設定
Elasticsearchの登録されるapache2のpipelineを、レスポンスタイムも取得するよう修正する。
/usr/share/filebeat/module/apache2/access/ingest/default.json
{
  "description": "Pipeline for parsing Apache2 access logs. Requires the geoip and user_agent plugins.",
  "processors": [{
    "grok": {
      "field": "message",
      "patterns":[
+        "%{IPORHOST:apache2.access.remote_ip} - %{DATA:apache2.access.user_name} \\[%{HTTPDATE:apache2.access.time}\\] \"%{WORD:apache2.access.method} %{DATA:apache2.access.url} HTTP/%{NUMBER:apache2.access.http_version}\" %{NUMBER:apache2.access.response_code} (?:%{NUMBER:apache2.access.body_sent.bytes}|-)( \"%{DATA:apache2.access.referrer}\")?( \"%{DATA:apache2.access.agent}\")?( %{NUMBER:apache2.access.response_time})?",
-        "%{IPORHOST:apache2.access.remote_ip} - %{DATA:apache2.access.user_name} \\[%{HTTPDATE:apache2.access.time}\\] \"%{WORD:apache2.access.method} %{DATA:apache2.access.url} HTTP/%{NUMBER:apache2.access.http_version}\" %{NUMBER:apache2.access.response_code} (?:%{NUMBER:apache2.access.body_sent.bytes}|-)( \"%{DATA:apache2.access.referrer}\")?( \"%{DATA:apache2.access.agent}\")?",
        "%{IPORHOST:apache2.access.remote_ip} - %{DATA:apache2.access.user_name} \\[%{HTTPDATE:apache2.access.time}\\] \"-\" %{NUMBER:apache2.access.response_code} -"
        ],
      "ignore_missing": true
    }
Elasticsearchの作成されるFilebeatのIndexにapache2のresponse_timeのフィールドを追加する。
/etc/filebeat/fields.yml
- key: apache2
  title: "Apache2"
  description: >
    Apache2 Module
  short_config: true
  fields:
    - name: apache2
      type: group
      description: >
        Apache2 fields.
      fields:
        - name: access
          type: group
          description: >
            Contains fields for the Apache2 HTTPD access logs.
          fields:
            - name: remote_ip
              type: keyword
              description: >
                Client IP address.
            - name: user_name
              type: keyword
              description: >
                The user name used when basic authentication is used.
            - name: method
              type: keyword
              example: GET
              description: >
                The request HTTP method.
            - name: url
              type: keyword
              description: >
                The request HTTP URL.
            - name: http_version
              type: keyword
              description: >
                The HTTP version.
            - name: response_code
              type: long
              description: >
                The HTTP response code.
+           - name: response_time
+             type: long
+             description: >
+               The HTTP response time.
            - name: body_sent.bytes
              type: long
              format: bytes
              description: >
                The number of bytes of the server response body.
apache2モジュールを有効化し、ログファイルのパスを設定する。
[root@es ~]# filebeat modules enable apache2
/etc/filebeat/modules.d/apache2.yml
- module: apache2
  # Access logs
  access:
    enabled: true

    # Set custom paths for the log files. If left empty,
    # Filebeat will choose the paths depending on your OS.
-   #var.paths:
+    var.paths: ["/var/log/httpd/access_log**"]

  # Error logs
  error:
-   enabled: true
+   enabled: false

    # Set custom paths for the log files. If left empty,
    # Filebeat will choose the paths depending on your OS.
    #var.paths:
filebeatを起動する。
[root@es ~]# systemctl restart filebeat
Kibanaで確認
ログ生成のために何回かアクセスしておく。
[root@es ~]# curl http://127.0.0.1
[root@es ~]# curl http://127.0.0.1
[root@es ~]# curl http://127.0.0.1
http://[サーバのIP]:5601でKibanaへ接続する。
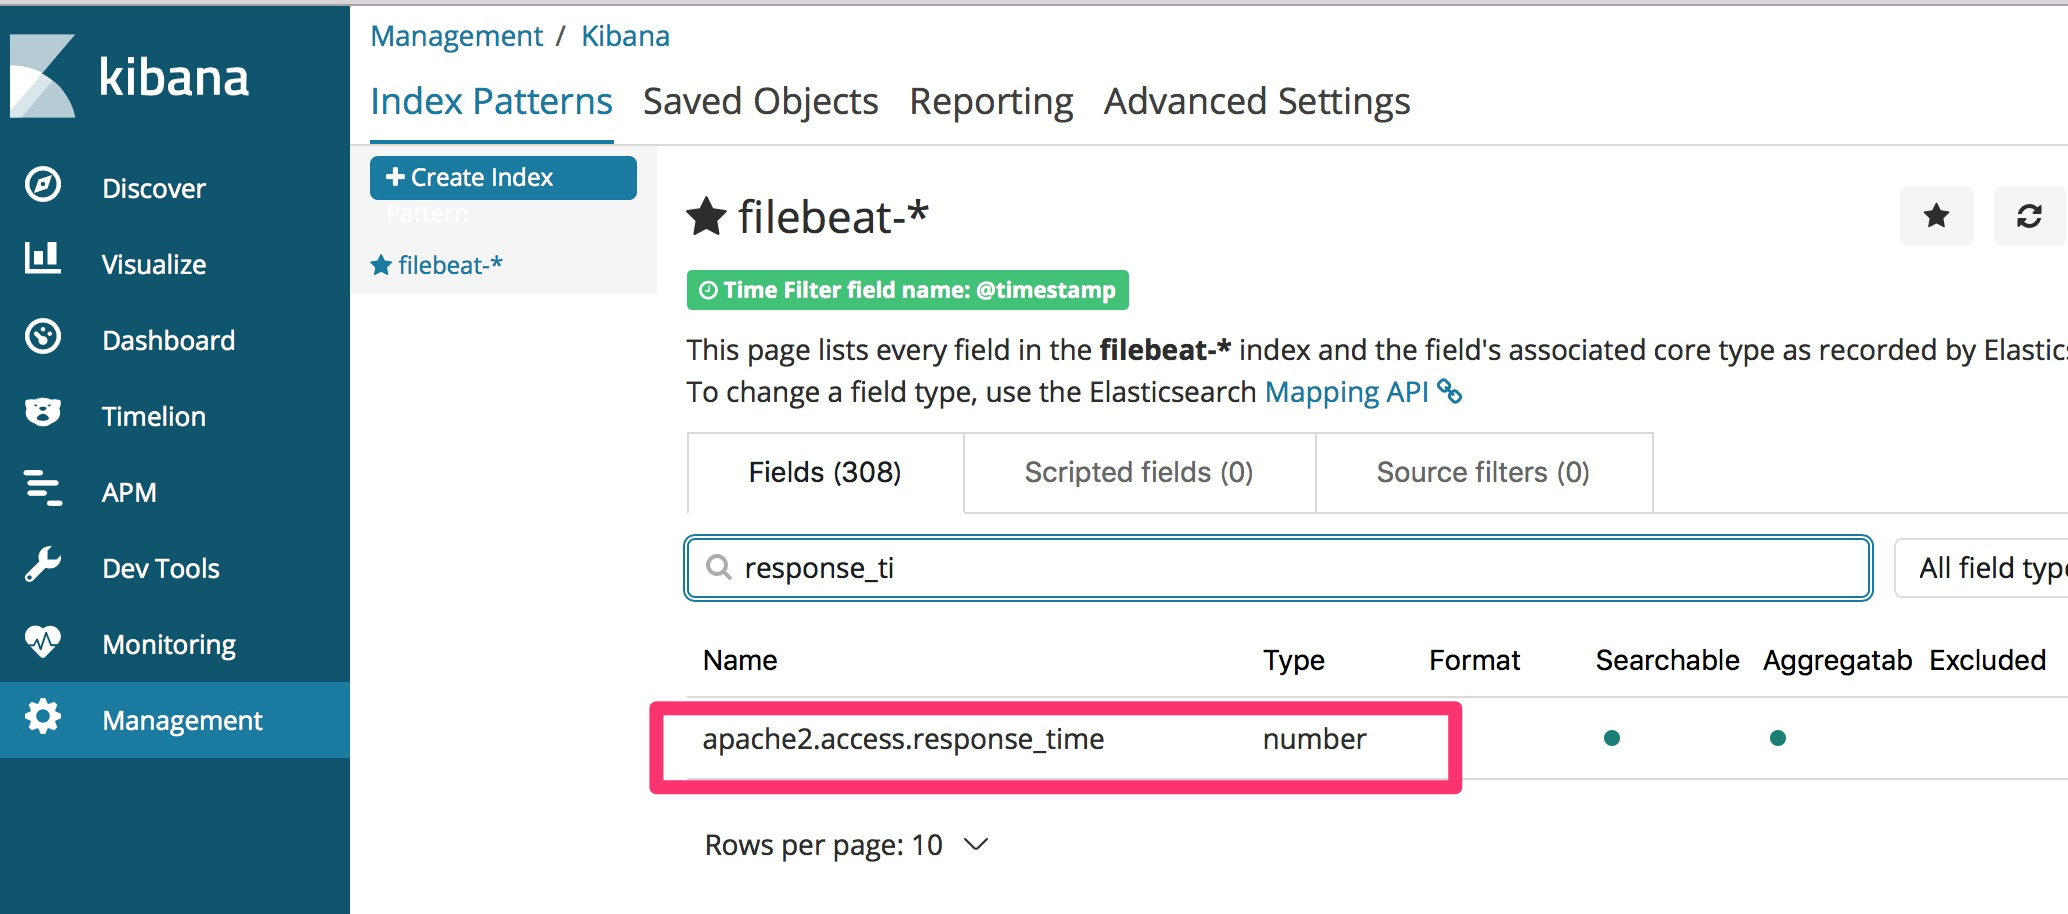
filebeat-6.3.1-2018.07.13 のIndexが作成されていたので、KibanaのIndex Patternsへ登録する。
フィールドに追加したresponse_timeを発見。
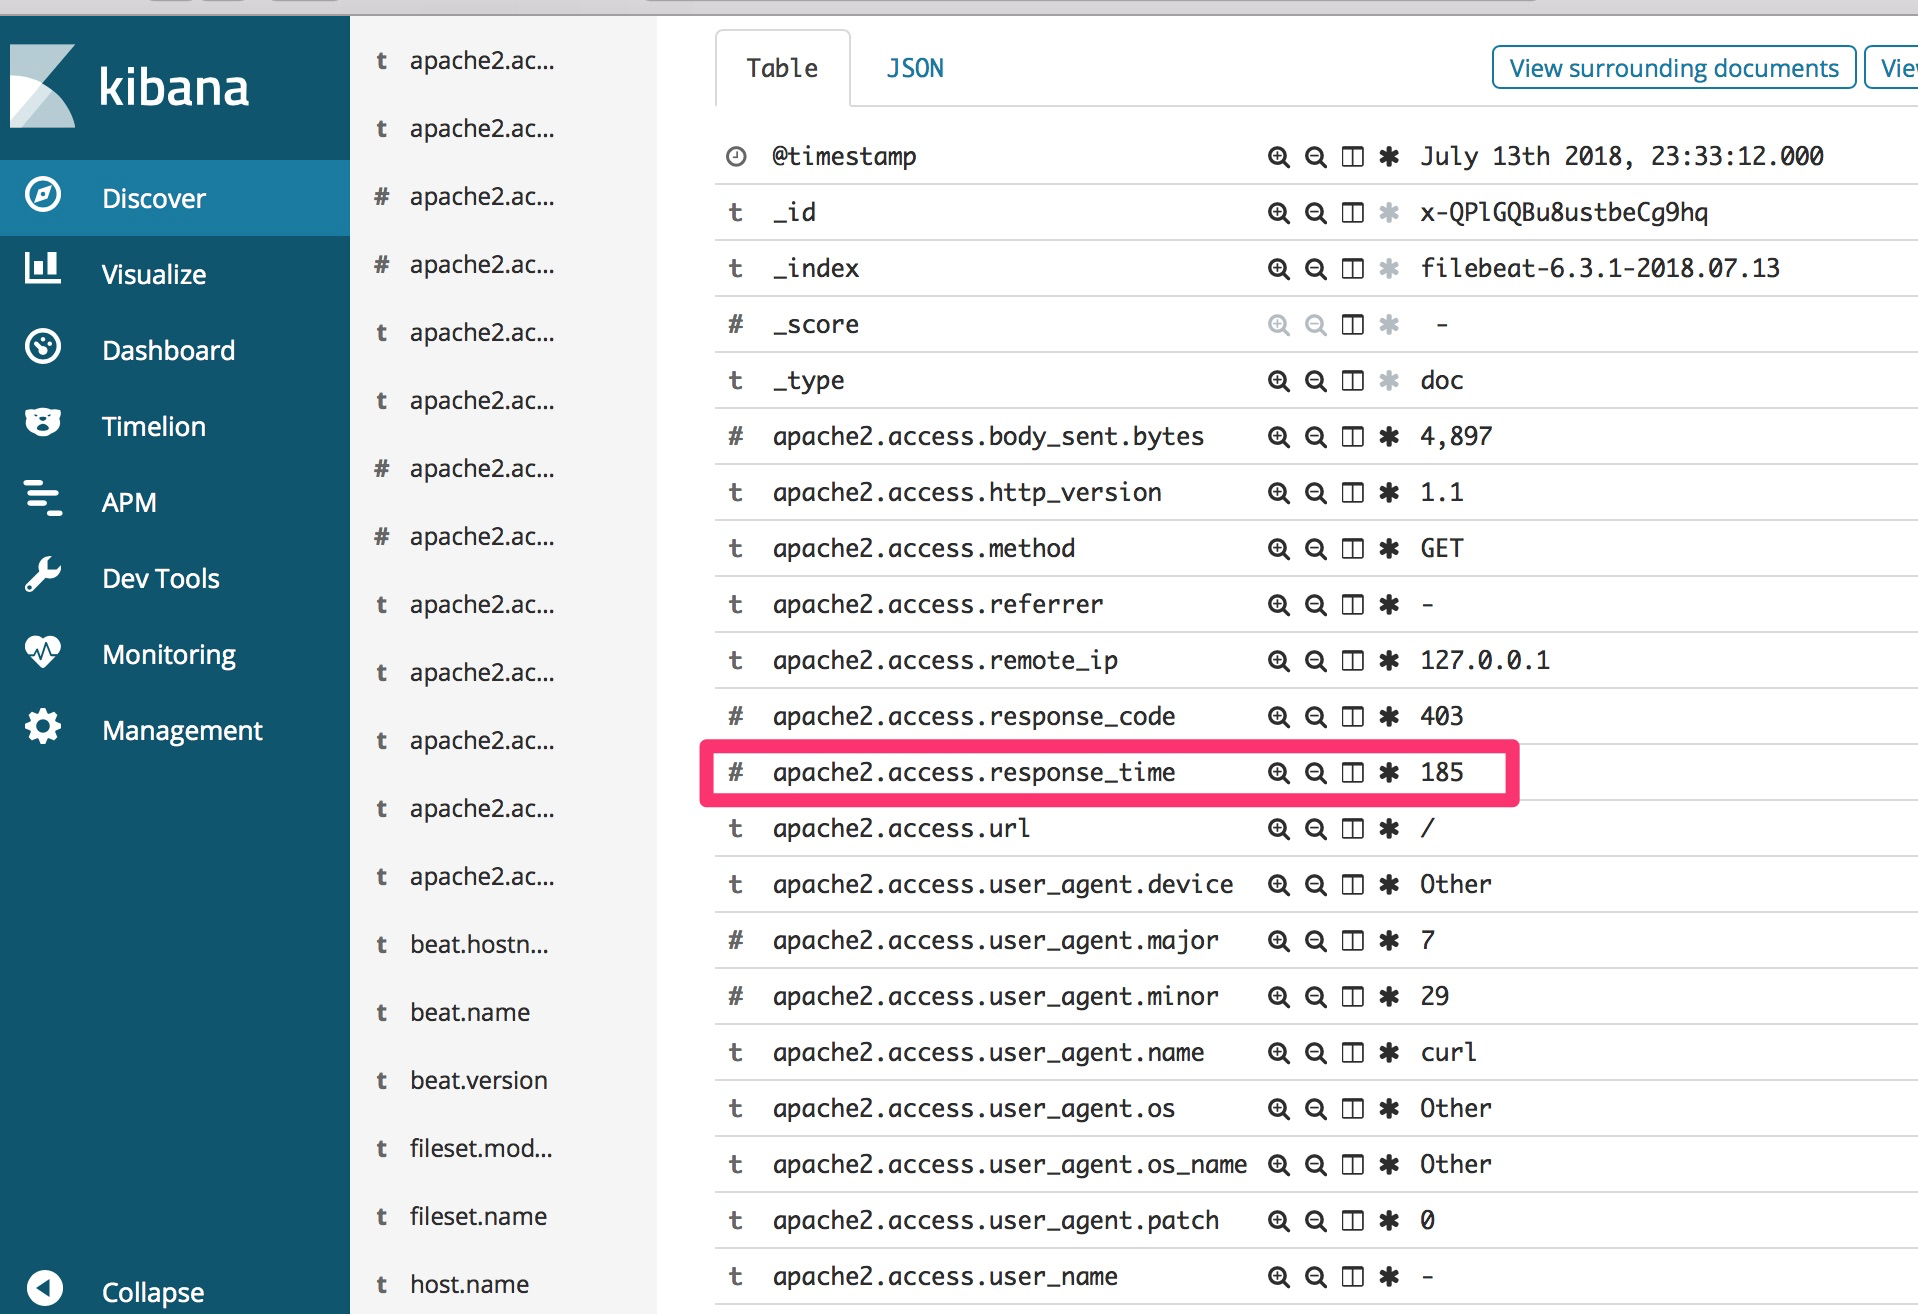
ちゃんとレスポンスタイム取得できた。
終わりに
Filebeatのapache2に標準でレスポンスタイムのフィールドほしかったなあ。。。
けど、ElasticsearchもKibanaも6.3になって、かなり機能追加されて便利になってる。