Pythonで世界地図-16(画像を貼り付け)
https://qiita.com/ty21ky/items/11f247293b1ddb1e1ff8
で画像の貼付け・回転をやりましたが、imgファイルの左下と右上の座標を指定するのですが、計算が結構厄介で、回転が無い場合は縦横比がおかしくなるだけですが、回転すると大きさも変わってしまうし、imgが菱形になってしまいます。
まだ完璧ではありませんが、左右に90度回転させることができます。(90度以上、−90度以上は今の所出来ません。)
画像の条件
画像の上下左右の空白部分をなくす。(表示する画像の大きさがファイルの大きさ)
座標の計算のやり方が完璧にわかったわけではなく、どうしても画像が歪んだり、大きさが変わったりします。
そこで、計算した結果に係数を掛けて修正しています。
#!/usr/bin/python3
# coding: UTF-8

import numpy as np
from mpl_toolkits.basemap import Basemap
import matplotlib.pyplot as plt
from scipy import ndimage #画像回転
from mpl_toolkits.basemap import pyproj

#画像の右上の座標を計算する関数
def coordinate_calc(angle=0.,img_width=0.,img_height=0.,lat_img=0.): #angle(回転角度-単位(度)),img_width(画像の実際の幅-単位m),img_height(画像の実際の高さ(長さ)-単位m),lat_img(画像を貼り付ける北緯-単位(度))
    angle = abs(angle)
    earth_r = 6378100. #地球半径(m)
    y_a_m = 360. / (2 * np.pi * earth_r)
    x_coefficient=4.2613636*10**-8*angle**4-5.7765152*10**-6*angle**3+6.7708333*10**-5*angle**2+0.0261783009*angle+0.1866071429
    y_coefficient=9.46969697*10**-9*angle**4-2.7146465*10**-6*angle**3+7.8598485*10**-5*angle**2-0.0021473665*angle+1.1696428571

    def x_a_m(lat_img):
        return 360. / (earth_r * np.cos(np.radians(lat_img)) * 2 * np.pi)

    if angle == 0:
        coordinate = [img_width * x_a_m(lat_img), img_height * y_a_m]
        #print(x_a_m,y_a_m)
        return coordinate

    elif -90. <= angle and angle <= 90.:
        x_m = img_height * np.sin(np.radians(lat_img)) + img_width * np.cos(np.radians(lat_img))
        y_m = img_height * np.cos(np.radians(lat_img)) + img_width * np.sin(np.radians(lat_img))
        coordinate1 = [x_m * x_a_m(lat_img) * x_coefficient, y_m * y_a_m * y_coefficient]
        return coordinate1

    else:
        return -1 #回転角度の引数が異常

font = {'family':'IPAGothic'} #日本語Fontを指定
fig = plt.figure()

lon1 = 135.406 #地図中心
lat1 = 34.683
lon2 = 0.01 #地図の大きさ(片側)
lat2 = 0.01

map = Basemap(llcrnrlon=lon1-lon2,llcrnrlat=lat1-lat2,urcrnrlon=lon1+lon2,urcrnrlat=lat1+lat2,resolution='i',projection='cyl')

map.drawcoastlines() #海岸線

rot = 30 #回転角度(回転が無い場合は0を指定)
i_width = 38. #「いずも」の全幅
i_hight = 248. #「いずも」の全長
img_xy1 = coordinate_calc(rot,i_width,i_hight,lat1) #(角度,img幅,img高さ,imgを貼り付ける北緯)
#護衛艦「いずも」イメージ貼り付け
x00, y00 = map(lon1, lat1) #IMG左下
x01, y01 = map(lon1 + img_xy1[0], lat1 + img_xy1[1]) #IMG右上

#plt.imshow(plt.imread('./izumo.png'),  extent = (x00, x01, y00, y01)) #画像を回転しない場合

#画像を回転する場合(以下3行が必要)
img = plt.imread('./izumo.png')
rotated_img = ndimage.rotate(img, rot) #角度 +(左回り),-(右回り)---左回り、右回り共にx01,y01は同じ
plt.imshow(rotated_img,  extent = (x00, x01, y00, y01))

plt.show()
護衛艦「いずも」の画像

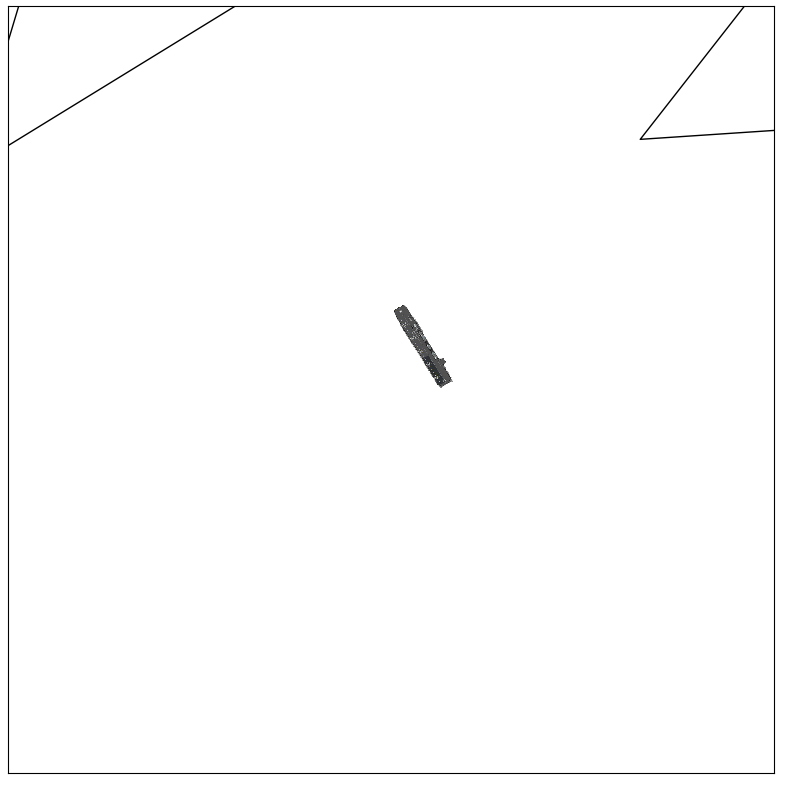
X-2をさがせ
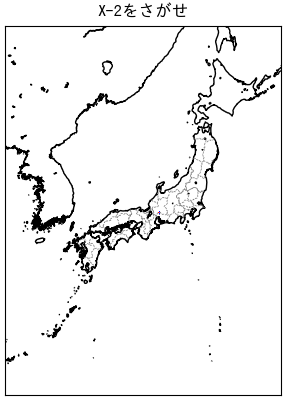
ウォーリーをさがせ!の先進技術実証機 X-2版です。
ウォーリーをさがせ!と違いめちゃ簡単です。
日本地図の中にX-2が2機隠れています。
ズーム(虫眼鏡)で拡大していくと見えるようになります。
X-2は実物大で描画されているのでメチャ小さいです。
シェープファイルの描画とイメージを2枚重ねて描画しています。
ヒント
1,2回目の試験飛行
コードを見ればすぐにわかります。
X-2をさがせ.py
#!/usr/bin/python3
# coding: UTF-8

from mpl_toolkits.basemap import Basemap
import matplotlib.pyplot as plt
import japan_border2 as jb2 #都府県境界線
import numpy as np
from scipy import ndimage #画像回転
from mpl_toolkits.basemap import pyproj

#画像の右上の座標を計算する関数
def coordinate_calc(angle=0.,img_width=0.,img_height=0.,lat_img=0.): #angle(回転角度-単位(度)),img_width(画像の実際の幅-単位m),img_height(画像の実際の高さ(長さ)-単位m),lat_img(画像を貼り付ける北緯-単位(度))
    angle = abs(angle)
    earth_r = 6378100. #地球半径(m)
    y_a_m = 360. / (2 * np.pi * earth_r)
    x_coefficient=4.2613636*10**-8*angle**4-5.7765152*10**-6*angle**3+6.7708333*10**-5*angle**2+0.0261783009*angle+0.1866071429
    y_coefficient=9.46969697*10**-9*angle**4-2.7146465*10**-6*angle**3+7.8598485*10**-5*angle**2-0.0021473665*angle+1.1696428571

    def x_a_m(lat_img):
        return 360. / (earth_r * np.cos(np.radians(lat_img)) * 2 * np.pi)

    if angle == 0:
        coordinate = [img_width * x_a_m(lat_img), img_height * y_a_m]
        #print(x_a_m,y_a_m)
        return coordinate

    elif -90. <= angle and angle <= 90.:
        x_m = img_height * np.sin(np.radians(lat_img)) + img_width * np.cos(np.radians(lat_img))
        y_m = img_height * np.cos(np.radians(lat_img)) + img_width * np.sin(np.radians(lat_img))
        coordinate1 = [x_m * x_a_m(lat_img) * x_coefficient, y_m * y_a_m * y_coefficient]
        return coordinate1

    else:
        return -1 #回転角度の引数が異常

font = {'family': 'IPAGothic'}  # 日本語Fontを指定

fig     = plt.figure() #shp_color
ax      = fig.add_subplot(111)

lon1 = 135.50
lat1 = 34.5
lon2 = 12.0
lat2 = 13.0

map = Basemap(llcrnrlon=lon1-lon2,llcrnrlat=lat1-lat2,urcrnrlon=lon1+lon2,urcrnrlat=lat1+lat2,resolution='i',projection='merc', area_thresh = 0.0)

map.drawcoastlines() #海岸線

jb2.prefectural_bound(map = map) #都府県境界線

x_t,y_t = map(136.851, 35.4)

map.readshapefile('/home/ty/自衛隊/base/gifu_base', 'gifu_base', color ='r') #岐阜基地シェイプファイルデータを描画
#plt.text(x_t, y_t, '岐阜基地', fontsize=4, color='r', **font)

#基地イメージ貼り付け
x00, y00 = map(136.915273, 35.257711) #IMG左下
x01, y01 = map(136.925348, 35.262066) #IMG右上

plt.imshow(plt.imread('/home/ty/自衛隊/小牧空港1.png'),  extent = (x00, x01, y00, y01))

#「X-2」イメージ貼り付け
rot = 0 #回転角度(回転が無い場合は0を指定)
i_width = 9.099 #「X-2」の全幅
i_hight = 14.174  #「X-2」の全長

x02_1,y02_1 = 136.918813,35.259197
x02, y02 = map(x02_1,y02_1)
img_xy1 = coordinate_calc(rot,i_hight,i_width,y02_1) #(角度,img幅,img高さ,imgを貼り付ける北緯)

x10, y10 = map(x02_1, y02_1) #IMG左下
x11, y11 = map(x02_1 + img_xy1[0], y02_1 + img_xy1[1]) #IMG右上

plt.imshow(plt.imread('./X-2上面図1.png'),  extent = (x10, x11, y10, y11)) #画像を回転しない場合

#「X-2」イメージ貼り付け
rot = 0 #回転角度(回転が無い場合は0を指定)
i_width = 9.099 #「X-2」の全幅
i_hight = 14.174  #「X-2」の全長

x03_1,y03_1 = 136.866634,35.397998
x03, y03 = map(x03_1,y03_1)
img_xy1 = coordinate_calc(rot,i_hight,i_width,y03_1) #(角度,img幅,img高さ,imgを貼り付ける北緯)

x10, y10 = map(x03_1, y03_1) #IMG左下
x11, y11 = map(x03_1 + img_xy1[0], y03_1 + img_xy1[1]) #IMG右上

plt.imshow(plt.imread('./X-2上面図1.png'),  extent = (x10, x11, y10, y11)) #画像を回転しない場合

plt.title('X-2をさがせ', **font)

plt.show()
シェープファイルも必要です。
http://ty21ky.web.fc2.com/JSDF/gifu_base.zip
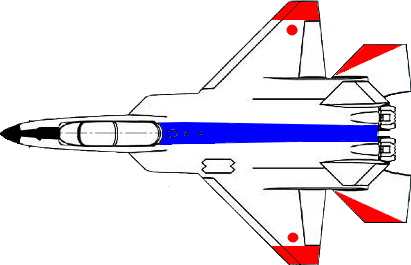
下のイメージを「X-2上面図1.png」で保存
下のイメージを「小牧空港1.png」で保存
元のイメージは大きすぎてアップ出来ませんでした。
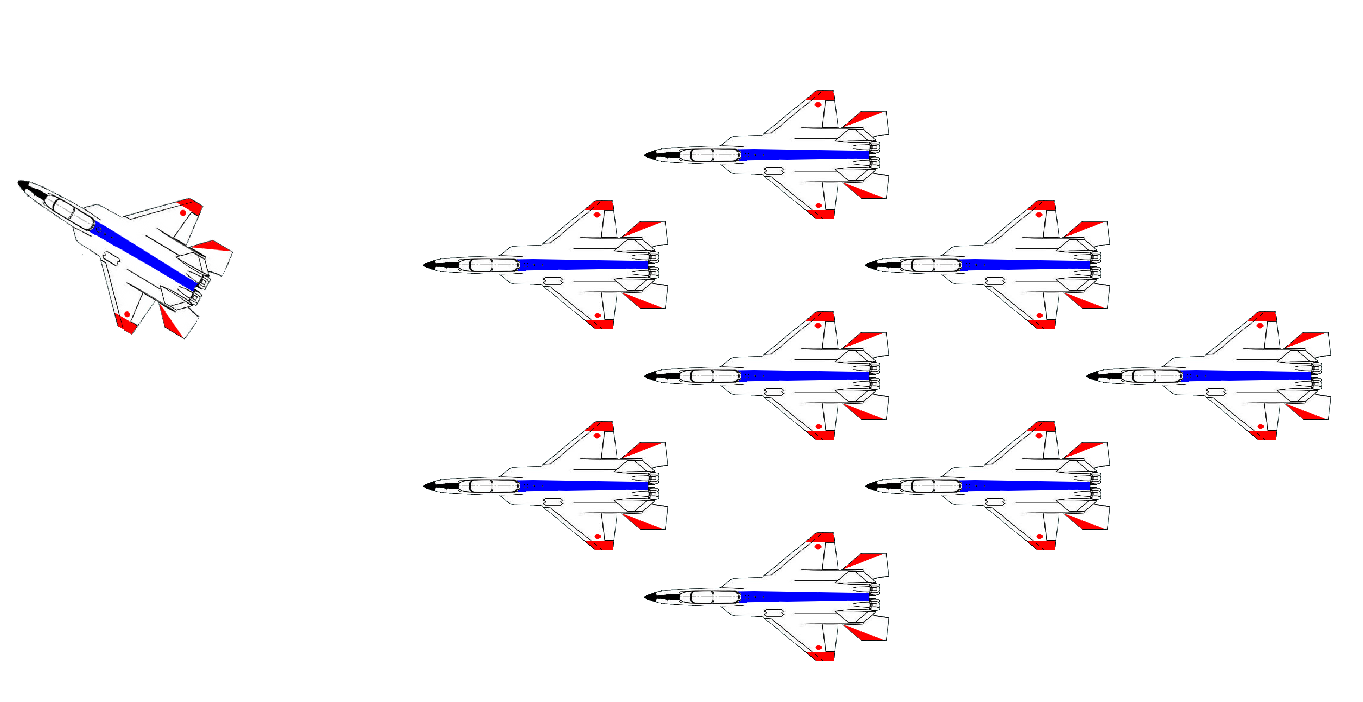
編隊飛行
注意)画像の回転である角度の時に画像が歪みます。
#!/usr/bin/python3
# coding: UTF-8

import numpy as np
from mpl_toolkits.basemap import Basemap
import matplotlib.pyplot as plt
from scipy import ndimage #画像回転
from mpl_toolkits.basemap import pyproj

#画像の右上の座標を計算する関数
def coordinate_calc(angle=0.,img_width=0.,img_height=0.,lat_img=0.): #angle(回転角度-単位(度)),img_width(画像の実際の幅-単位m),img_height(画像の実際の高さ(長さ)-単位m),lat_img(画像を貼り付ける北緯-単位(度))
    angle = abs(angle)
    earth_r = 6378100. #地球半径(m)
    y_a_m = 360. / (2 * np.pi * earth_r)
    x_coefficient=4.2613636*10**-8*angle**4-5.7765152*10**-6*angle**3+6.7708333*10**-5*angle**2+0.0261783009*angle+0.1866071429
    y_coefficient=9.46969697*10**-9*angle**4-2.7146465*10**-6*angle**3+7.8598485*10**-5*angle**2-0.0021473665*angle+1.1696428571

    def x_a_m(lat_img):
        return 360. / (earth_r * np.cos(np.radians(lat_img)) * 2 * np.pi)

    if angle == 0:
        coordinate = [img_width * x_a_m(lat_img), img_height * y_a_m]
        #print(x_a_m,y_a_m)
        return coordinate

    elif -90. <= angle and angle <= 90.:
        x_m = img_height * np.sin(np.radians(lat_img)) + img_width * np.cos(np.radians(lat_img))
        y_m = img_height * np.cos(np.radians(lat_img)) + img_width * np.sin(np.radians(lat_img))
        coordinate1 = [x_m * x_a_m(lat_img) * x_coefficient, y_m * y_a_m * y_coefficient]
        return coordinate1

    else:
        return -1 #回転角度の引数が異常

#画像を描画関数(回転あり)
def img_draw_rot(map, name, rot, img_x, img_y, coordinate_x, coordinate_y): #mapのインスタンス、ファイル名、回転角度、画像の幅x、画像の高さy、貼り付ける東経北緯(左下)x、y
    x_1,y_1 = map(coordinate_x, coordinate_y) #IMG左下
    img_xy2 = coordinate_calc(rot,img_x,img_y,y_1) #(角度,img幅,img高さ,imgを貼り付ける北緯)
    x_2, y_2 = map(x_1 + img_xy2[0], y_1 + img_xy2[1]) #IMG右上
    if rot == 0:
        plt.imshow(plt.imread(name),  extent = (x_1, x_2, y_1, y_2)) #画像を描画(回転なし)
    elif -90. <= rot and rot <= 90.:
        img = plt.imread(name)
        rotated_img = ndimage.rotate(img, rot) #角度 +(左回り),-(右回り)---左回り、右回り共にx01,y01は同じ
        plt.imshow(rotated_img,  extent = (x_1, x_2, y_1, y_2))
    else:
        pass

#--------
font = {'family':'IPAGothic'} #日本語Fontを指定
fig = plt.figure()

lon1 = 135.406 #地図中心
lat1 = 34.683
lon2 = 0.0005 #地図の大きさ(片側)
lat2 = 0.0005

map = Basemap(llcrnrlon=lon1-lon2,llcrnrlat=lat1-lat2,urcrnrlon=lon1+lon2,urcrnrlat=lat1+lat2,resolution='c',projection='cyl')

map.drawcoastlines() #海岸線

length = 14.174
width = 9.099
dx,dy = 0.0002*0.7,0.0001*0.7
img_draw_rot(map, './X-2上面図1.png', -30., length, width, lon1-dx*3, lat1+0.00005) #mapのインスタンス、ファイル名、回転角度、画像の幅x、画像の高さy、貼り付ける座標(左下)x、y
#img_draw_rot(map, './X-2上面図1.png', 0, length, width, lon1-dx*2, lat1) #mapのインスタンス、ファイル名、画像の幅x、画像の高さy、貼り付ける東経北緯(左下)x、y
img_draw_rot(map, './X-2上面図1.png', 0, length, width, lon1-dx, lat1+dy)
img_draw_rot(map, './X-2上面図1.png', 0, length, width, lon1-dx, lat1-dy)
img_draw_rot(map, './X-2上面図1.png', 0, length, width, lon1, lat1+dy*2)
img_draw_rot(map, './X-2上面図1.png', 0, length, width, lon1, lat1)
img_draw_rot(map, './X-2上面図1.png', 0, length, width, lon1, lat1-dy*2)
img_draw_rot(map, './X-2上面図1.png', 0, length, width, lon1+dx, lat1+dy)
img_draw_rot(map, './X-2上面図1.png', 0, length, width, lon1+dx, lat1-dy)
img_draw_rot(map, './X-2上面図1.png', 0, length, width, lon1+dx*2, lat1)

plt.show()
画像を描画関数(回転なし)と(回転あり)を1つにまとめました。