小ネタ
円の方程式
x^2\times y^2 = 1\\
\therefore  y = \pm\sqrt{1 - x ^2}
作ってみる。
SPL
| makeresults count=2
| streamstats count
| eval x=if(count=1,-1.100,1.100)
| makecontinuous span=0.001 x
| dedup x
| eval y = exact(sqrt(1 - pow(x,2)))
| eval y = if(abs(x) <= 1,y,NULL)
| eval yy = -y
| table x y yy
解説
一旦作ってみたら−1と1のところの線が切れ気味だったので余白を作成。
dedupが入っているのは、なぜかxが重複したため。なんでだろう ![]()
精度が大事ということでexact()は必要です。
表示
circle
<dashboard>
<label>circle</label>
<row>
<panel depends="$alwaysHideCSS$">
<html>
<style>
#chartPanel{
width:500px !important;
}
</style>
</html>
</panel>
</row>
<row>
<panel id="chartPanel">
<chart>
<search>
<query>| makeresults count=2
| streamstats count
| eval x=if(count=1,-1.100,1.100)
| makecontinuous span=0.001 x
| dedup x
| eval y = exact(sqrt(1 - pow(x,2)))
| eval y = if(abs(x) <= 1,y,NULL)
| eval yy = -y
| table x y yy</query>
<earliest>-24h@h</earliest>
<latest>now</latest>
<sampleRatio>1</sampleRatio>
</search>
<option name="charting.chart">line</option>
<option name="charting.legend.placement">none</option>
<option name="charting.fieldColors">{y:#000000, yy:#000000}</option>
<option name="height">550</option>
</chart>
</panel>
</row>
</dashboard>
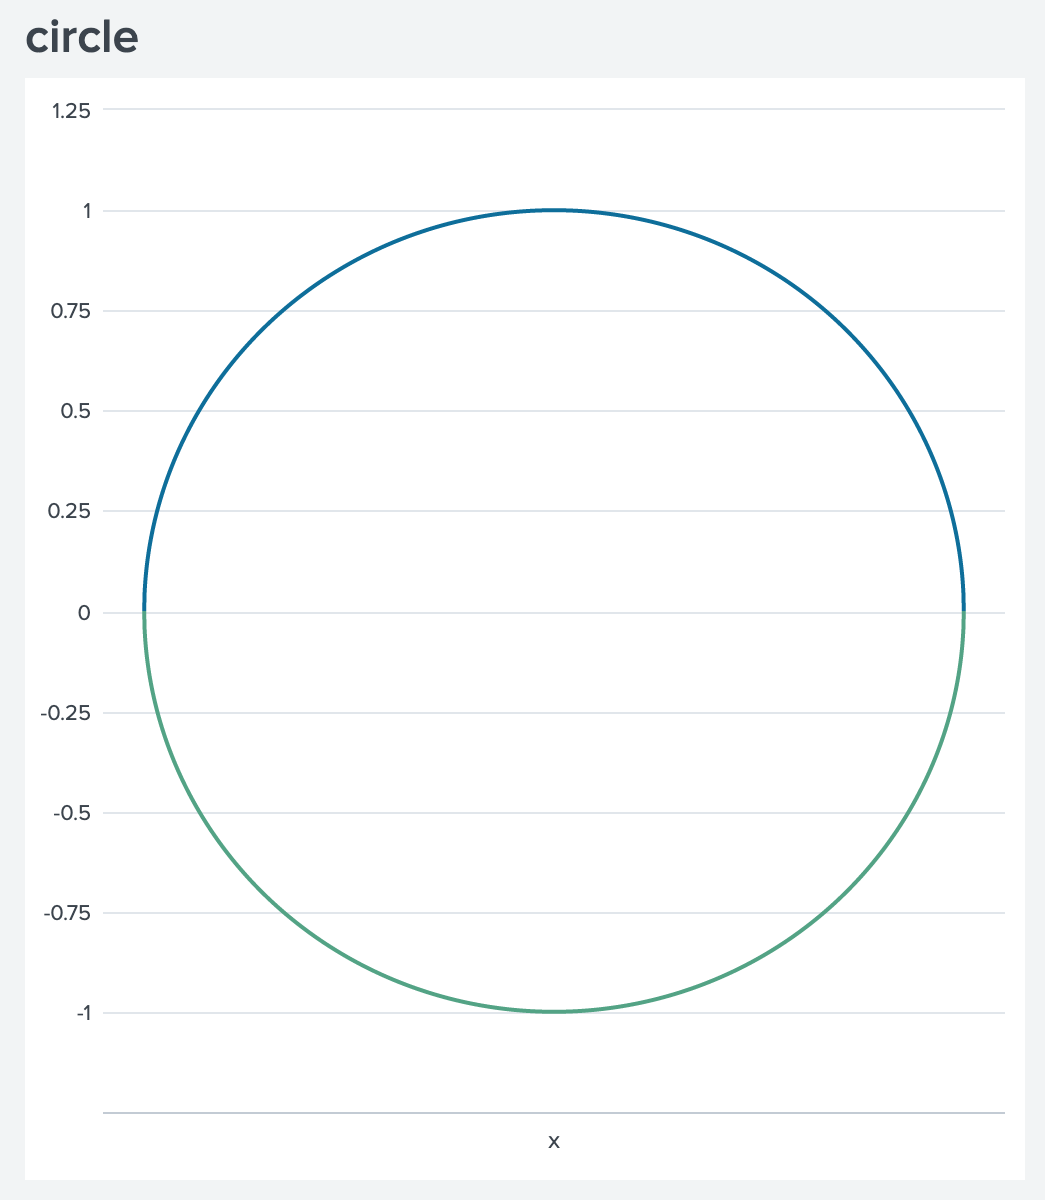
サーチ画面で描画すると縦横の比率の問題できれいに見えないのでダッシュボードを作成。
縦はSimpleXMLにオプションがあるのに横はCSSを書かないといけないのが切ない。
完成図
まとめ
結構きれいに描けるな〜
Splunkの使い方としては全力で別方向に向かってると思います。
最初方程式の展開をミスしていて、歪な形になったのは秘密です。![]()
