散布図行列の描画に続いて、こちらもやっていきます。
相関係数については以下2通りの算出方法をご紹介します。
1. pandasを用いた方法
2. scipyを用いた方法
まずは、例のごとくサンプルデータの作成
python
from sklearn import datasets
import pandas as pd
iris = datasets.load_iris()
df = pd.DataFrame(data=iris['data'],
                  columns=iris['feature_names']
                 )
# dfの中身
| sepal length (cm) | sepal width (cm) | petal length (cm) | petal width (cm) | |
|---|---|---|---|---|
| 0 | 5.1 | 3.5 | 1.4 | 0.2 |
| 1 | 4.9 | 3.0 | 1.4 | 0.2 |
| 2 | 4.7 | 3.2 | 1.3 | 0.2 |
| ... | ... | ... | ... | ... |
1. pandasを用いた方法
python
corr_mat = df.corr(method='pearson')
# method='spearman'でスピアマン、'kendall'でケンドールも指定可能
corr_matの中身
| sepal length (cm) | sepal width (cm) | petal length (cm) | petal width (cm) | |
|---|---|---|---|---|
| sepal length (cm) | 1.000000 | -0.109369 | 0.871754 | 0.817954 |
| sepal width (cm) | 1.000000 | -0.109369 | 0.871754 | 0.817954 |
| petal length (cm) | 0.871754 | -0.420516 | 1.000000 | 0.962757 |
| petal width (cm) | 0.817954 | -0.356544 | 0.962757 | 1.000000 |
2.scipyを用いた方法
import scipy.stats as sts

corr_mat = np.zeros((df.shape[1], df.shape[1]))

for i in range(df.shape[1]):
    for j in range(df.shape[1]):
        corrtest = sts.pearsonr(df[df.columns[i]], df[df.columns[j]])
        # stats配下にspearmanrやkendalltauも存在
        corr_mat[i,j] = corrtest[0]

df_corr = pd.DataFrame(corr_mat, columns=df.columns, index=df.columns)
df_corrの中身
| sepal length (cm) | sepal width (cm) | petal length (cm) | petal width (cm) | |
|---|---|---|---|---|
| sepal length (cm) | 1.000000 | -0.109369 | 0.871754 | 0.817954 |
| sepal width (cm) | -0.109369 | 1.000000 | -0.420516 | -0.356544 |
| petal length (cm) | 0.871754 | -0.420516 | 1.000000 | 0.962757 |
| petal width (cm) | 0.817954 | -0.356544 | 0.962757 | 1.000000 |
ちなみにこのやり方だと、p値行列もだせます。
import scipy.stats as sts

pval_mat = np.zeros((df.shape[1], df.shape[1]))

for i in range(df.shape[1]):
    for j in range(df.shape[1]):
        corrtest = sts.pearsonr(df[df.columns[i]], df[df.columns[j]])
        pval_mat[i,j] = corrtest[1] # 第2要素にはp値が入っている!

df_corr = pd.DataFrame(pval_mat, columns=df.columns, index=df.columns)
df_corr
結果(小数点第3位以下は丸めてます)
| sepal length (cm) | sepal width (cm) | petal length (cm) | petal width (cm) | |
|---|---|---|---|---|
| sepal length (cm) | 0.0 | 0.18 | 0.0 | 0.0 |
| sepal width (cm) | 0.18 | 0.0 | 0.0 | 0.0 |
| petal length (cm) | 0.0 | 0.0 | 0.0 | 0.0 |
| petal width (cm) | 0.0 | 0.0 | 0.0 | 0.0 |
仕上げにヒートマップ化
import seaborne as sons
sns.heatmap(corr_mat,
            vmin=-1.0,
            vmax=1.0,
            center=0,
            annot=True, # True:格子の中に値を表示
            fmt='.1f',
            xticklabels=corr_mat.columns.values,
            yticklabels=corr_mat.columns.values
           )
plt.show()
出力
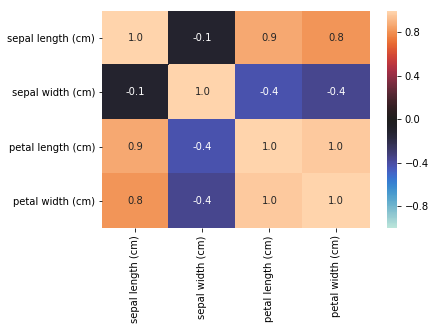
直感的に相関を把握できます。
ちなみに、heatmapにはcmap=といったパラメータもあり
お好みの色相を選べます。