plotlibというPure RustのSVGを生成するライブラリがあります。
use plotlib::page::Page;
use plotlib::scatter::{Scatter, Style};
use plotlib::style::Point;
use plotlib::view::ContinuousView;
fn main() {
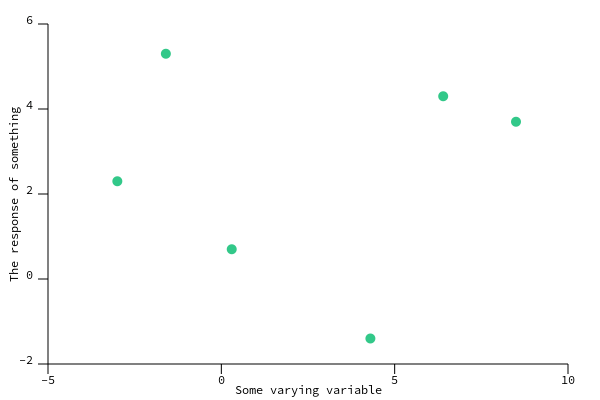
let data = [
(-3.0, 2.3),
(-1.6, 5.3),
(0.3, 0.7),
(4.3, -1.4),
(6.4, 4.3),
(8.5, 3.7),
];
let s = Scatter::from_slice(&data).style(
// プロット点の色を指定
Style::new().colour("#35C788"),
);
let v = ContinuousView::new()
.add(&s)
.x_range(-5., 10.)
.y_range(-2., 6.)
.x_label("Some varying variable")
.y_label("The response of something");
// SVGとして保存する
Page::single(&v).save("scatter.svg").unwrap();
}
QiitaはSVGを埋め込めないのでimagemagickでPNGにしてあります
convert scatter.{svg,png}