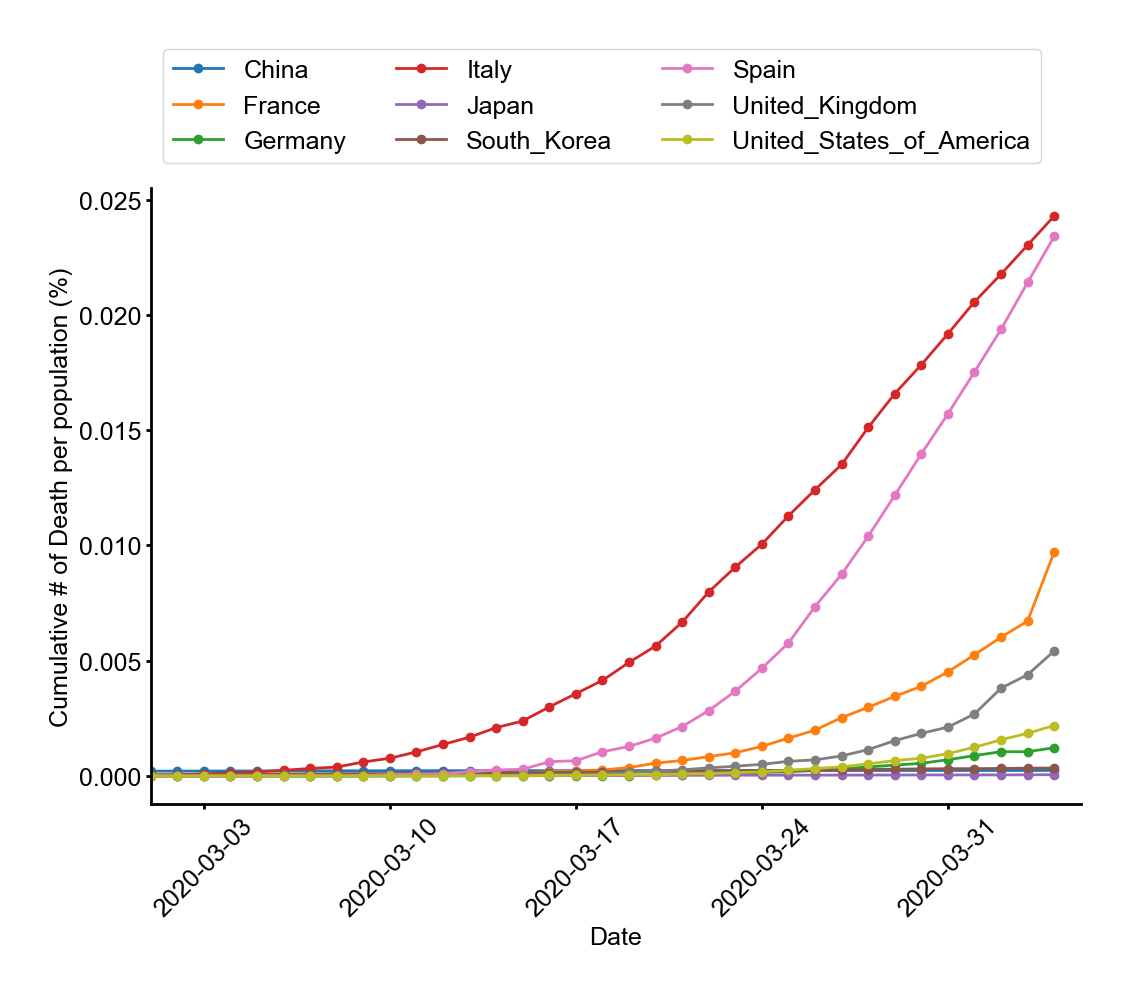
目的
COVID-19の人口当たりの死者数を国別に計算する。感染者数で比べるのは人口も検査数も国ごとに違うのでナンセンス。調べてもなかなか出てこなかったり、日付が古かったりしたので自作しました。
データソース
国別に感染者数、死者数、2018年の人口がまとめられているデータがありました。2020年4月4日現在のデータだったので「data20200404.csv」として保存しました。
ソースコード
はじめてpandasを使ってみました。便利。
import pandas as pd
import matplotlib.pyplot as plt
import datetime as dt

coutry_for_analysis = [
    'United_States_of_America', 'United_Kingdom', 'France', 'Germany', 'Japan',
    'Italy', 'China', 'South_Korea', 'Spain'
]

data = pd.read_csv('data20200404.csv')
data['dateRep'] = pd.to_datetime(data['dateRep'], format="%d/%m/%Y")

fig = plt.figure(figsize=(12, 8))

plt.rcParams['font.family'] = 'Arial'
plt.rcParams['font.size'] = 18
plt.rcParams['xtick.major.width'] = 2.0
plt.rcParams['ytick.major.width'] = 2.0
ax = fig.add_subplot(111)
ax.set_xlabel('Date')
ax.set_ylabel('Cumulative # of Death per population (%)')
ax.spines['top'].set_linewidth(0)
ax.spines['bottom'].set_linewidth(2.0)
ax.spines['left'].set_linewidth(2.0)
ax.spines['right'].set_linewidth(0)
ax.tick_params(axis='x', rotation=45)
ax.set_xlim([dt.date(2020, 3, 1), dt.date(2020, 4, 5)])

for key, grp in data.groupby('countriesAndTerritories'):
    if key in coutry_for_analysis:
        grp = grp.sort_values('dateRep')
        ax.plot(
            grp['dateRep'],
            100.0 * grp['deaths'].cumsum() / grp['popData2018'],
            label=key,
            linewidth=2.0,
            marker='o',
            markersize=6)

ax.legend(ncol=3, bbox_to_anchor=(0., 1.02, 1., 0.102), loc=3, fontsize=18)

plt.savefig('figure.svg', bbox_inches='tight', pad_inches=0.5)
プロット
何を思うかはあなた次第。