やりたいこと
ParaViewで絵を描いてぐりぐり回したい。
ParaViewでVTKレガシーフォーマットを使う その2に,UnstructuredGridの使い方の例がある。
Rubyはできないので,Pythonで真似をする。
誤訳があるかも。
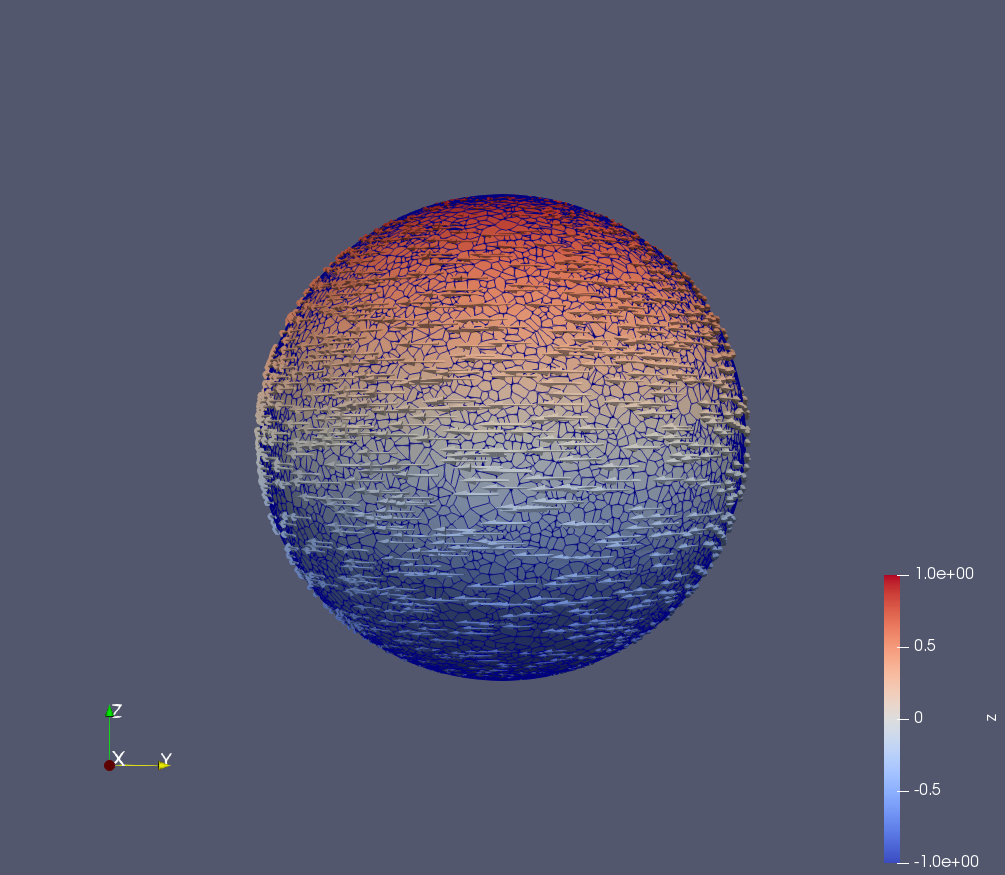
球面上のランダムな節点上にデータがあるとき,
Cellを指定しなくても点を打てて,ベクトルを描けることが分かった。
スカラー量で色を塗りたい。
Vornoi図
scipy.spatial.SphericalVoronoiを使う。
点を与えると,verticesに頂点,regionsにセルに使われている頂点の番号のリストが入る。
VTKレガシーフォーマット
CELLSに与えるsizeはセルに使われる頂点の個数+1の和となる。+1はセルを閉じることになる点の分。+1を忘れるとParaView(VTK)がお亡くなりなる。
結果
githubに置く。