共有すること
Railsを用いて、GoogleMap と NASA(アメリカ航空宇宙局)が公開する災害情報(今回は世界中で発生している「地滑り」)を組み合わせ災害情報を可視化する。
利用する技術
Ruby on Rails 5
JavaScript
活用したサイト
【Google Maps API】https://developers.google.com/maps/documentation/javascript/tutorial?hl=ja
【NASAオープンデータ(地滑り)】
https://data.nasa.gov/resource/tfkf-kniw.json
(世界中で発生した地滑り(直近1000件)の、発生日時・国名・緯度・経度・被害状況をJSONで格納していています。)
ポイント
① NASAのオープンデータから抽出したJSONデータをRubyの配列に格納。
② その配列をViewに投げて、レンダリング。
事前準備
Google Maps APIサイトより、APIキーを発行してください。
コード例
①Railsで、sampleアプリを作成
command
$ rails new sample
②sampleアプリに移動
command
$ cd sample
③ homeコントローラとtopアクションを作成
command
$ rails g controller home top
④ home_controller.rb に、NASAのオープンデータからJSONを抽出するコードを入力
app/controllers/home/home_controller.rb
class HomeController < ApplicationController
  def top
      require 'json'
      require 'uri'
      require 'net/http'
      require 'csv'

      uri = URI.parse('https://data.nasa.gov/resource/tfkf-kniw.json')
      json = Net::HTTP.get(uri)
      @results = JSON.parse(json)

      @array = Array.new


      #@resultsから各情報を抽出

      #発生日時:["date"].to_s
      #国名:["countryname"].to_s
      #緯度:["geolocation"]["coordinates"][1].to_s
      #経度:["geolocation"]["coordinates"][0].to_s
      #人口:["population"].to_s
      #地滑りの規模:["landslide_size"].to_s
      #死亡者数:["fatalities"].to_s
      #負傷者数:["injuries"].to_s


      @results.each do |result|
 @array.push(date:result["date"].to_date,country:result["countryname"],
             lat:result["geolocation"]["coordinates"][1],
             lng:result["geolocation"]["coordinates"][0],
             magnitude:result["landslide_size"],
             fatalities:result["fatalities"],
             injuryies:result["injuries"])
      end
  end
end
⑤ ④で抽出したデータを、application.html.ermに投げる。
app/assets/layouts/application.html.erb
<!DOCTYPE html>
<html>
  <head>
    <title>GoogleMAP × NASA Landslide API</title>
    <%= csrf_meta_tags %>

    <%= stylesheet_link_tag    'application', media: 'all', 'data-turbolinks-track': 'reload' %>
    <%= javascript_include_tag 'application', 'data-turbolinks-track': 'reload' %>

    <script async defer
    src="https://maps.googleapis.com/maps/api/js?key=[YOUR GOOGLEMAP API KEY]&callback=initMap">
    </script>

 <script>

        function initMap() {
        var place = {lat: 35, lng: 135};

        var map = new google.maps.Map(document.getElementById('map'), {
          zoom: 3,
          center: place,
          mapTypeId: 'satellite',
        });

        position = <%= @array.to_json.html_safe %>;

        for(var i=0; i<position.length; i++){
        var marker = new google.maps.Marker({
          position: position[i],
          icon: {
            path: google.maps.SymbolPath.CIRCLE,
            scale: parseInt(position[i].fatalities)/8,
            strokeColor:'white',
            fillColor:'red',
            fillOpacity:0.5,
            strokeWeight:0.5,
          },
          map: map,
          title: String("発生日:" + position[i].date + " | 死者数:" + position[i].fatalities)
        });
        }
    }
    </script>
  </head>

  <body>
    <%= yield %>
  </body>
</html>
⑥ top.html.erbを下記のように設定
app/views/home/top.html.erb
<div id="map"></div>
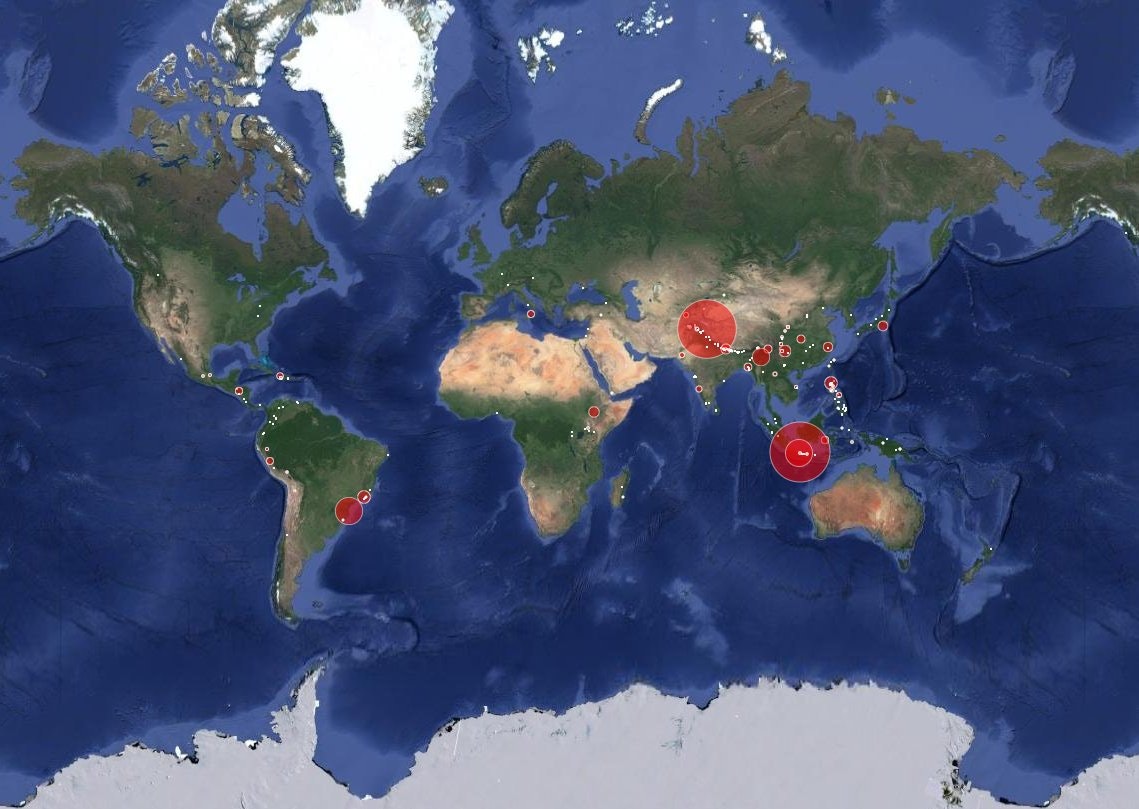
実行結果
command
$ rails s
http://localhost:3000/ にアクセスするとブラウザに下記のような画面が表示される。