More than 5 years have passed since last update.
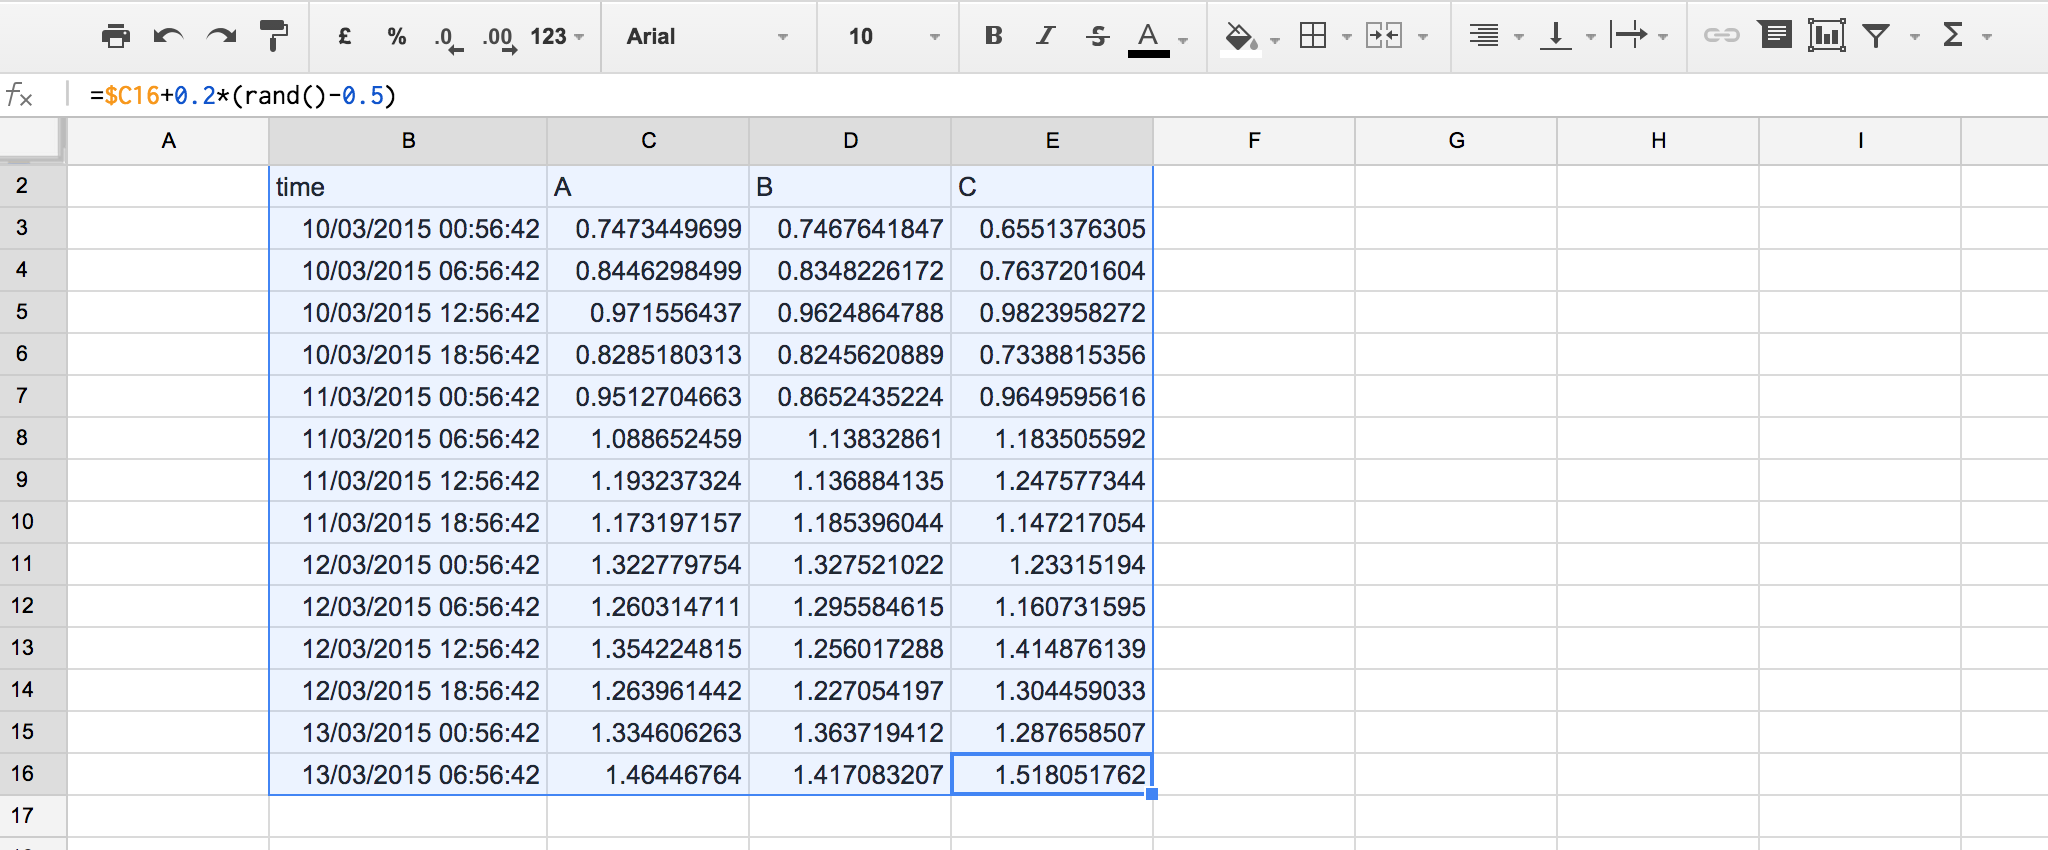
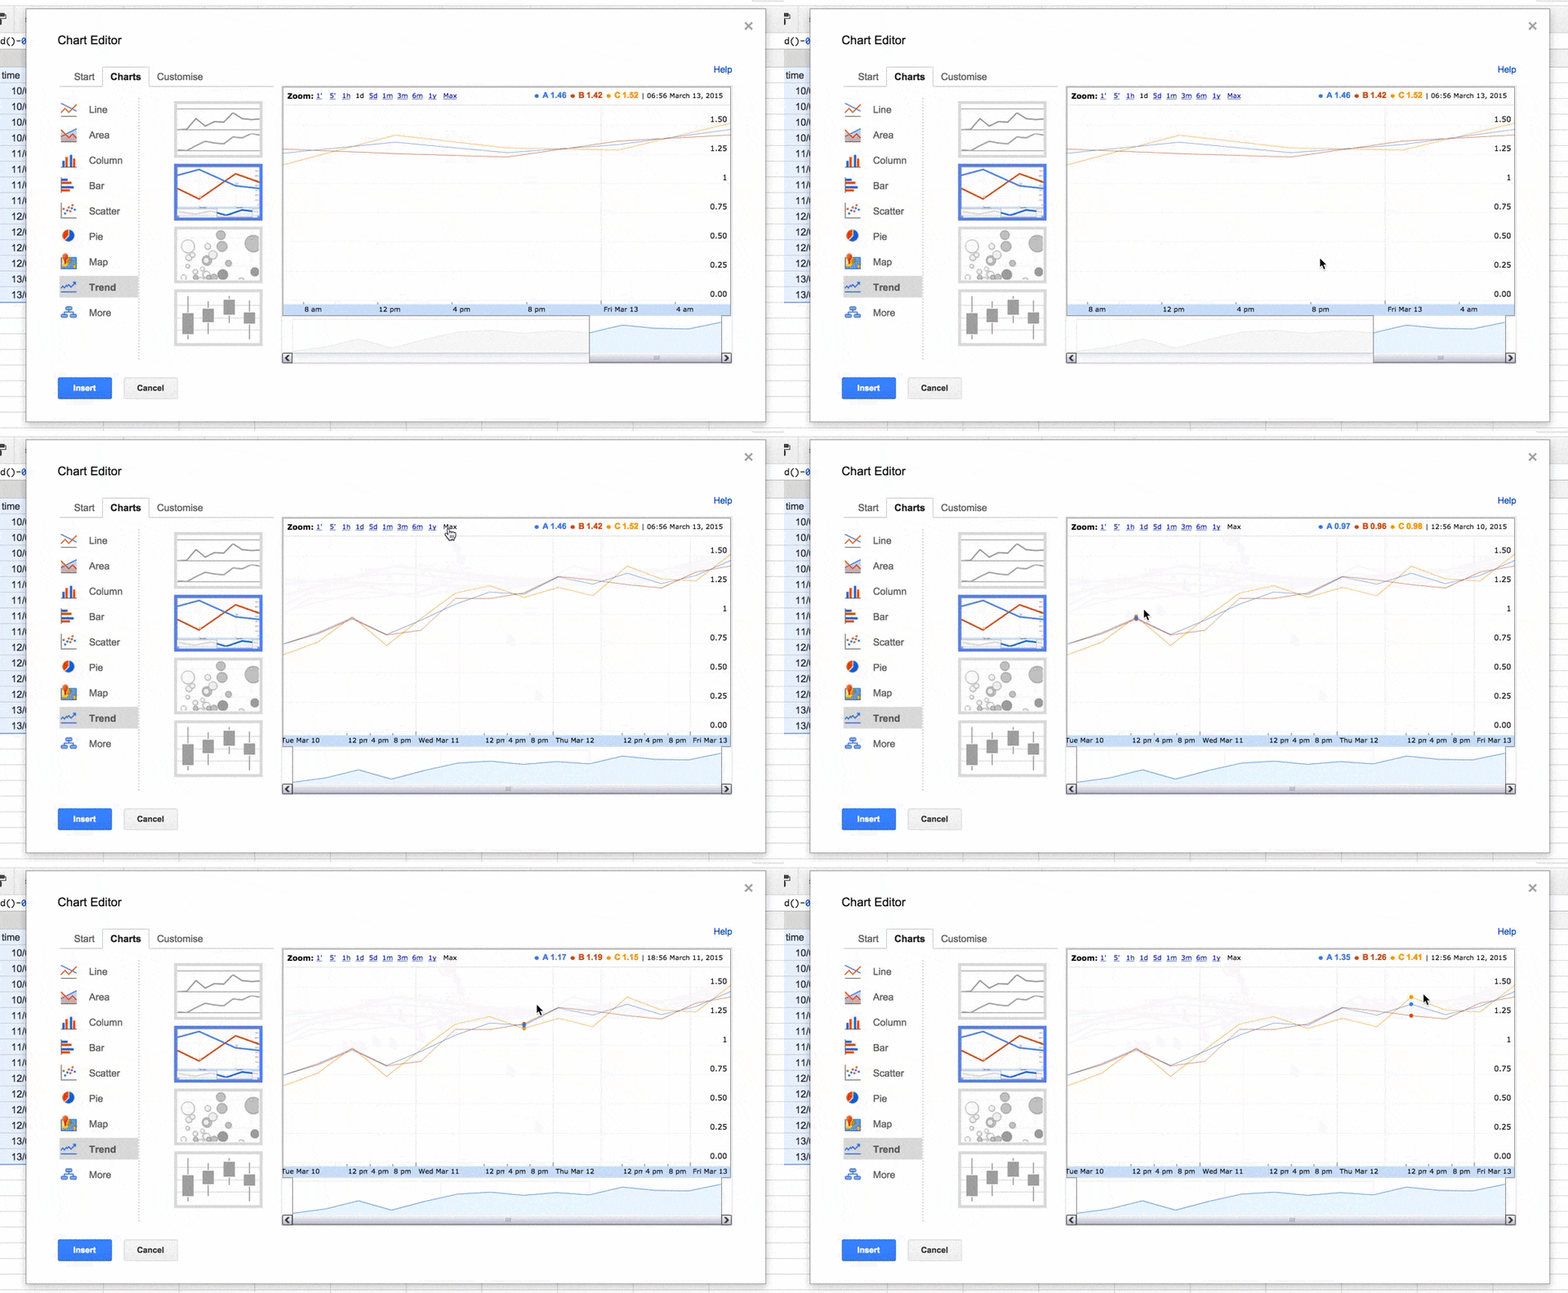
Google Driveで時系列データをインタラクティブに可視化する
Last updated at Posted at 2015-03-10
Register as a new user and use Qiita more conveniently
- You get articles that match your needs
- You can efficiently read back useful information
- You can use dark theme
List of users who liked
32


