Splunkが提供しているk8sのモニタリングappを使ってk8sのログとかを集めて可視化してみる。
必要なもの
k8sの環境(AWSさんが提供しているkopsでの作り方を参照しました)
https://aws.amazon.com/jp/blogs/news/configure-kubernetes-cluster-on-aws-by-kops/テスト用のpodとかいろいろ(今回はguestbook使ってます)
https://github.com/kubernetes/examples/tree/master/guestbookSplunkのdocker-it-monitoring
https://github.com/splunk/docker-itmonitoring
手順
kopsでk8sの環境作成
#S3のbucket作成
[xxxxx@xxxx-mbp-c9067] # export S3_BUCKET=example-state-store-$(cat /dev/random | LC_ALL=C tr -dc "[:alpha:]" | tr '[:upper:]'
 '[:lower:]' | head -c 32)
[xxxxx@xxxx-mbp-c9067] # export KOPS_STATE_STORE=s3://${S3_BUCKET}
[xxxxx@xxxx-mbp-c9067] # aws s3 mb $KOPS_STATE_STORE
make_bucket: example-state-store-xxxxxxxxxxxx

#S3のverioning有効
[xxxxx@xxxx-mbp-c9067] # aws s3api put-bucket-versioning \
  --bucket $S3_BUCKET \
  --versioning-configuration \
  Status=Enabled

#k8sのcluster作成
  [xxxxx@xxxx-mbp-c9067] # kops create cluster \
  --name sudagawa-splunk.cluster.k8s.local \
  --zones ap-northeast-1a,ap-northeast-1c \
  --yes

#少し待った後に作成確認
[xxxxx@xxxx-mbp-c9067] # kops validate cluster
Using cluster from kubectl context: sudagawa-splunk.cluster.k8s.local

Validating cluster sudagawa-splunk.cluster.k8s.local

INSTANCE GROUPS
NAME                    ROLE    MACHINETYPE     MIN     MAX     SUBNETS
master-ap-northeast-1a  Master  m3.medium       1       1       ap-northeast-1a
nodes                   Node    t2.medium       2       2       ap-northeast-1a,ap-northeast-1c

NODE STATUS
NAME                                                    ROLE    READY
ip-172-20-47-79.ap-northeast-1.compute.internal         node    True
ip-172-20-51-170.ap-northeast-1.compute.internal        master  True
ip-172-20-95-19.ap-northeast-1.compute.internal         node    True

Your cluster sudagawa-splunk.cluster.k8s.local is ready
サンプルのpod配置
https://kubernetes.io/docs/tutorials/stateless-application/guestbook にしたがって実施すればOK
splunkの環境設定
このリポジトリからcloneしてくる
https://github.com/splunk/docker-itmonitoring
その中になるk8s-splunk-full-demo.yamlを編集
#各コンテナのimageを自分でdockerhubにあげたものに修正
#コンテナイメージはsplunkのofficialイメージからダウンロードしたものをそのままtag名を変更して、自分のdockerhubにupした
<修正箇所 計3箇所>
      containers:
      - name: splunkenterprise
        image: suda1234docker5678/splunkkube:7.0.0-monitor-k8s

#修正後、apply
[xxxxx@xxxx-mbp-c9067] # kubectl apply -f k8s-splunk-full-demo.yaml
serviceaccount/splunk created
clusterrole.rbac.authorization.k8s.io/splunk created
clusterrolebinding.rbac.authorization.k8s.io/splunk created
deployment.extensions/splunkenterprise created
service/splunkenterprise created
daemonset.extensions/ta-k8s-logs created
deployment.extensions/ta-k8s-meta created
[xxxxx@xxxx-mbp-c9067] #
[xxxxx@xxxx-mbp-c9067] #
[xxxxx@xxxx-mbp-c9067] #
[xxxxx@xxxx-mbp-c9067] # kubectl get services
NAME               TYPE           CLUSTER-IP       EXTERNAL-IP                                                                   PORT(S)                                        AGE
frontend           NodePort       100.67.234.105   <none>                                                                        80:32128/TCP                                   1m
kubernetes         ClusterIP      100.64.0.1       <none>                                                                        443/TCP                                        11m
redis-master       ClusterIP      100.68.248.80    <none>                                                                        6379/TCP                                       5m
redis-slave        ClusterIP      100.67.135.204   <none>                                                                        6379/TCP                                       3m
splunkenterprise   LoadBalancer   100.71.217.113   a888662d7834411e9a4a7062b676aca0-570875382.ap-northeast-1.elb.amazonaws.com   8000:32052/TCP,9997:32734/TCP,8088:31705/TCP   11s
[xxxxx@xxxx-mbp-c9067] #
splunkにアクセスしてみる
EXTERNAL-IPにELBのアドレスが割り当てられているので、http://ELBのDNS名:8000 でアクセス
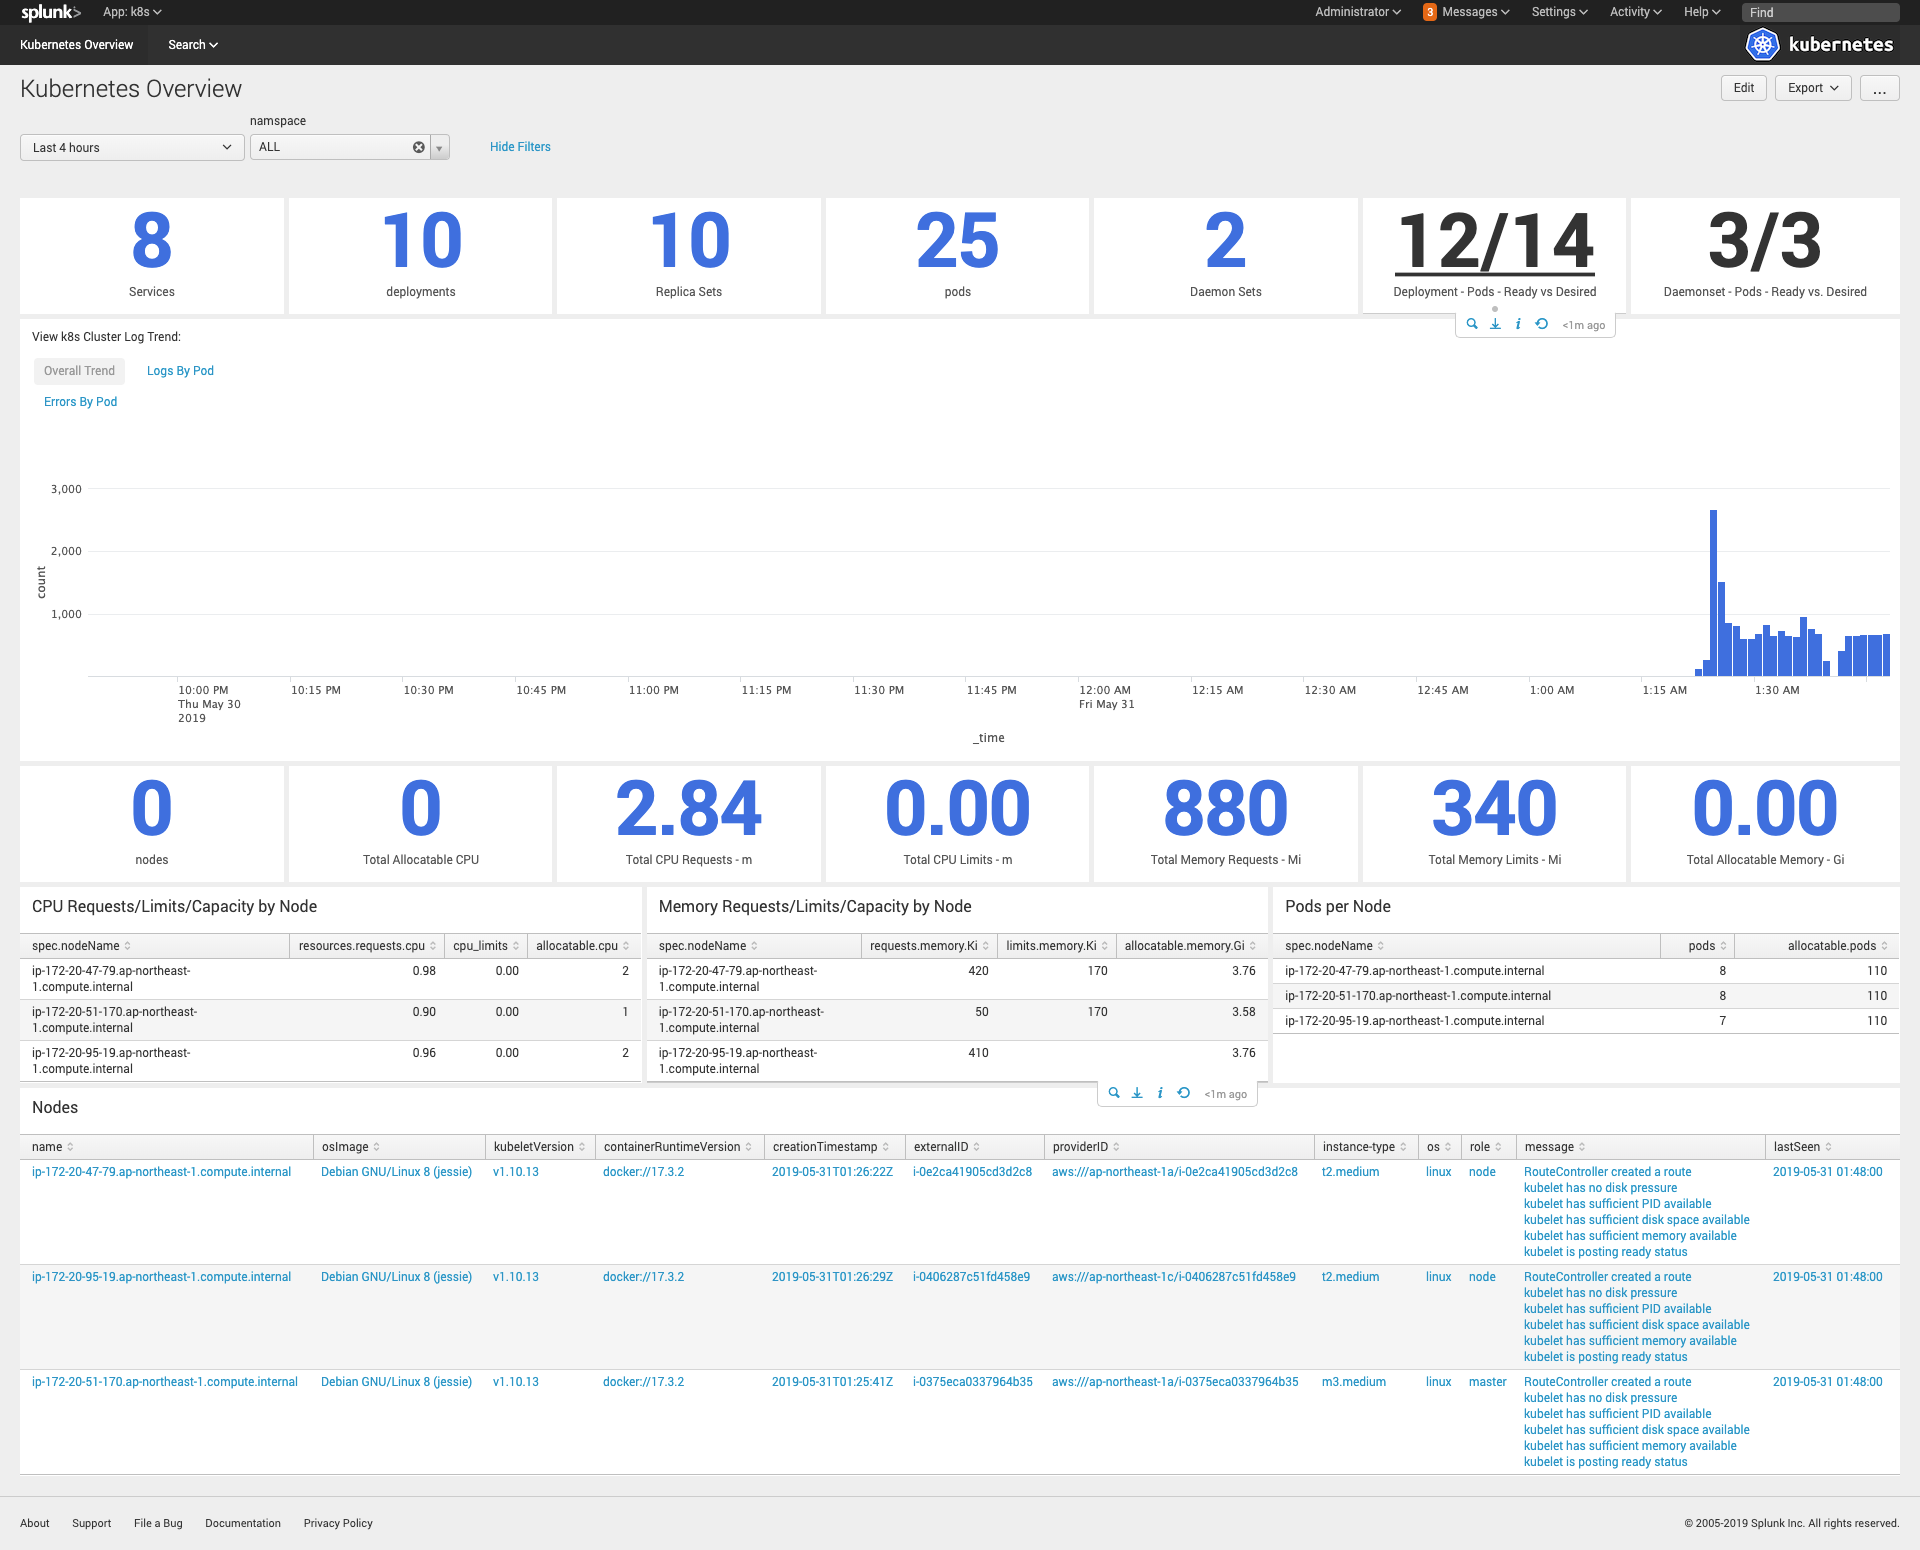
k8sアプリをのぞいてみる
各serviceとかdeployments、cpu/memoryとかのリソース情報、podの状況等が一覧で確認できる。
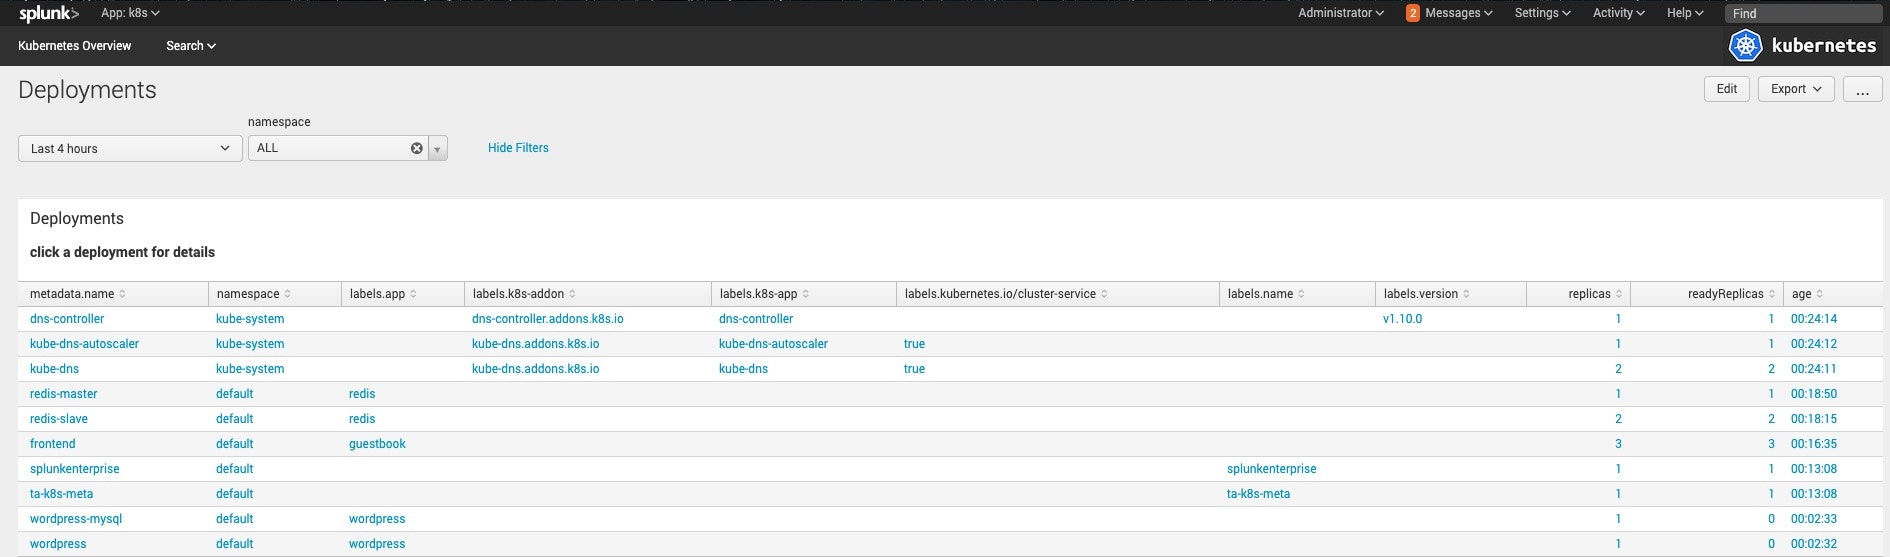
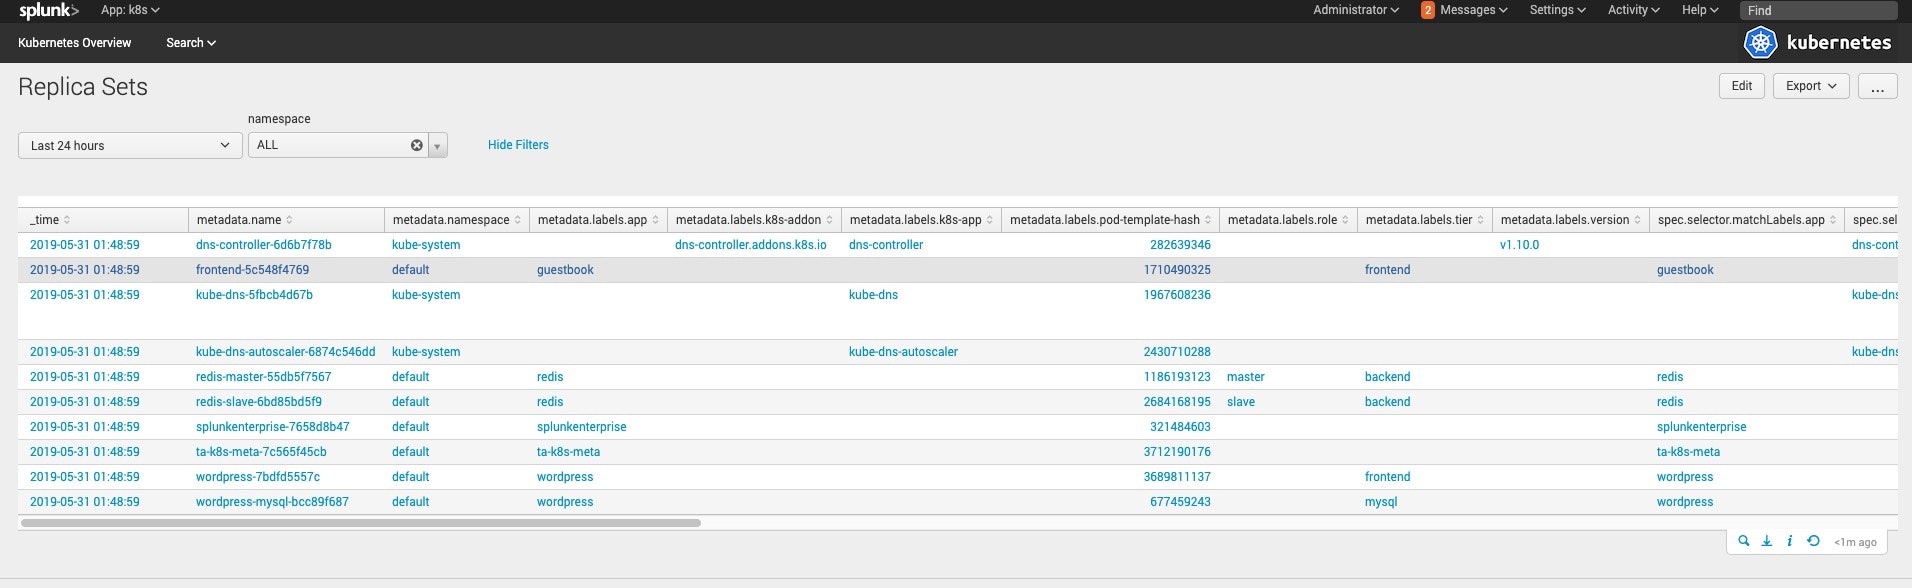
ドリルダウンしてみる
Serviceやdeploymentsの箇所をクリックすると、細かい情報が取れる。
最後に
結構簡単にデータを可視化できるので、便利かもですね。indexにデータを集めているので、状況に応じて自分でdashboard作ればOKかな。