IPython Notebookのインストール
環境: Ubuntu 14.04LTS
IPython Notebookのインストール
$ sudo apt-get install ipython-notebook
数値計算ライブラリや、グラフ描画ライブラリのインストール
$ sudo apt-get install python-matplotlib python-scipy python-pandas python-sympy python-nose
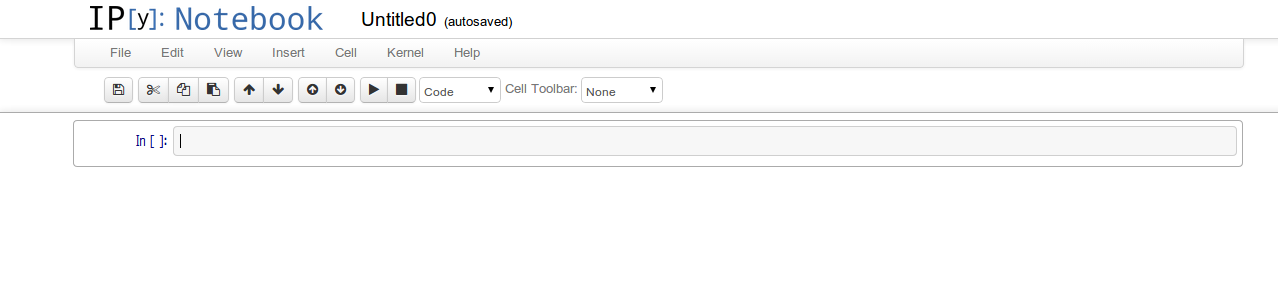
IPython Notebookの起動
$ ipython notebook
とコマンドを打つと、IPython Notebookがブラウザ上で起動する
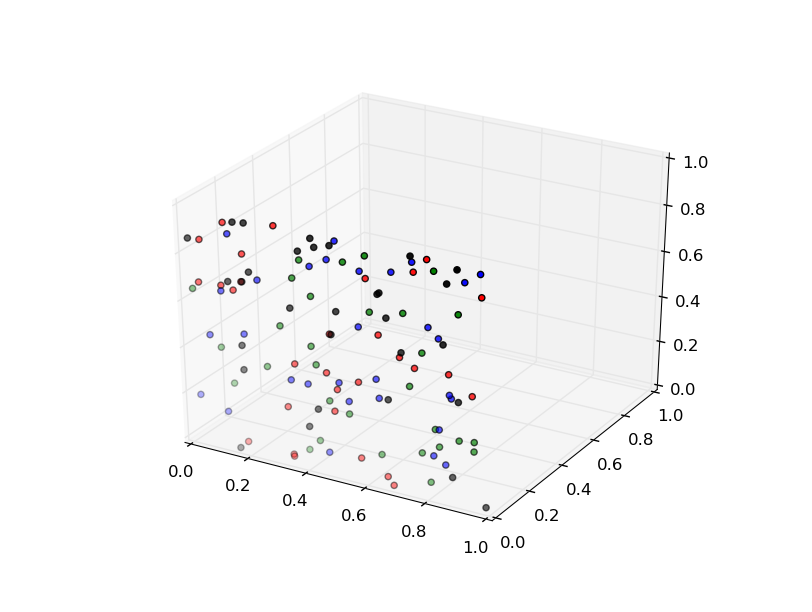
例:3Dバブルチャートを描画する
from mpl_toolkits.mplot3d import Axes3D
import numpy as np
import matplotlib.pyplot as plt

fig = plt.figure()
ax = fig.gca(projection='3d')
colors = ('r', 'g', 'b', 'k')
for c in colors:
    x = np.random.sample(30)
    y = np.random.sample(30)
    ax.scatter(x, y, 0, zdir='y', c=c)

ax.legend()
ax.set_xlim3d(0, 1)
ax.set_ylim3d(0, 1)
ax.set_zlim3d(0, 1)

plt.show()