目的
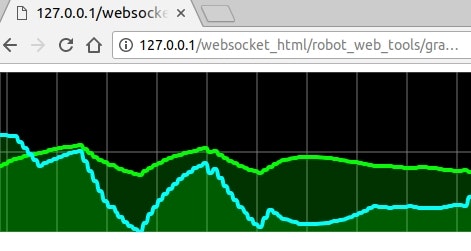
robotwebtoolsのroslibjsを使って、RosのTopicをWEBブラウザからグラフで表示する。
スマホなどでも、ROSのTopicの時系列データを見ることができる。
rviz/rqtが使えない環境でのデバックなどの活用が期待できる。
グラフ作成には、smoothiecharts.jsを使う。
smoothiecharts.js: http://smoothiecharts.org/
Github: https://github.com/joewalnes/smoothie/
Install
まず、ROSの動作するPCに、
rosbridge-server、robot-pose-publisher をインストールする。
ROS Indigoの場合
$ sudo apt-get install ros-indigo-rosbridge-server
$ sudo apt-get install ros-indigo-robot-pose-publisher
ROS Kineticの場合
$ sudo apt-get install ros-kinetic-rosbridge-server
$ sudo apt-get install ros-kinetic-robot-pose-publisher
apache2のインストール
Apache2(webサーバ)をインストールする。
sudo apt-get install apache2
launchファイルからのノード起動
rosbridge-server・robot-pose-publisher を起動する。
これと別にTopicを発行させておく。
<launch>
 <node pkg="robot_pose_publisher" type="robot_pose_publisher" name="robot_pose_publisher">
 </node>
 <include file="$(find rosbridge_server)/launch/rosbridge_websocket.launch" >
   <arg name="port" value="9090"/>
 </include>
</launch>
RoslibjsからTopicをsubscribeし、smoothiecharts.jsに渡すHTMLを作成し、/var/www以下に配置する。
<html>
  <head>
   <script src="https://raw.githubusercontent.com/joewalnes/smoothie/master/smoothie.js"></script>
   <script src="http://cdn.robotwebtools.org/EaselJS/current/easeljs.min.js"></script>
   <script src="http://cdn.robotwebtools.org/EventEmitter2/current/eventemitter2.min.js"></script>
   <script src="http://cdn.robotwebtools.org/roslibjs/current/roslib.js"></script>
   <script src="http://cdn.robotwebtools.org/ros2djs/current/ros2d.js"></script>

    <script type="text/javascript">
    var TimeLine1 = new TimeSeries();
    var value1 = '0.0';
    var ros = new ROSLIB.Ros({
    url : 'ws://127.0.0.1:9090'
    });

    var listener = new ROSLIB.Topic({
    ros : ros,
    name : '/teat_data',
    messageType : 'std_msgs/Float32'
    });

    listener.subscribe(function(message) {
    console.log('Received message on ' + listener.name + ': ' + message.data);
    value1=message.data;
    });

    setInterval(function() {
          TimeLine1.append(new Date().getTime(), value1);
        }, 50);

    function createTimeline() {
     var chart = new SmoothieChart();
     chart.addTimeSeries(TimeLine1, { strokeStyle: 'rgba(0, 255, 0, 1)', fillStyle: 'rgba(0, 255, 0, 0.2)', lineWidth: 4 });
         chart.streamTo(document.getElementById("chart"), 500);
    }
    </script>

  </head>
  <body onload="createTimeline()" >
    <canvas id="chart" width="640" height="160"></canvas>
  </body>
</html>
参考