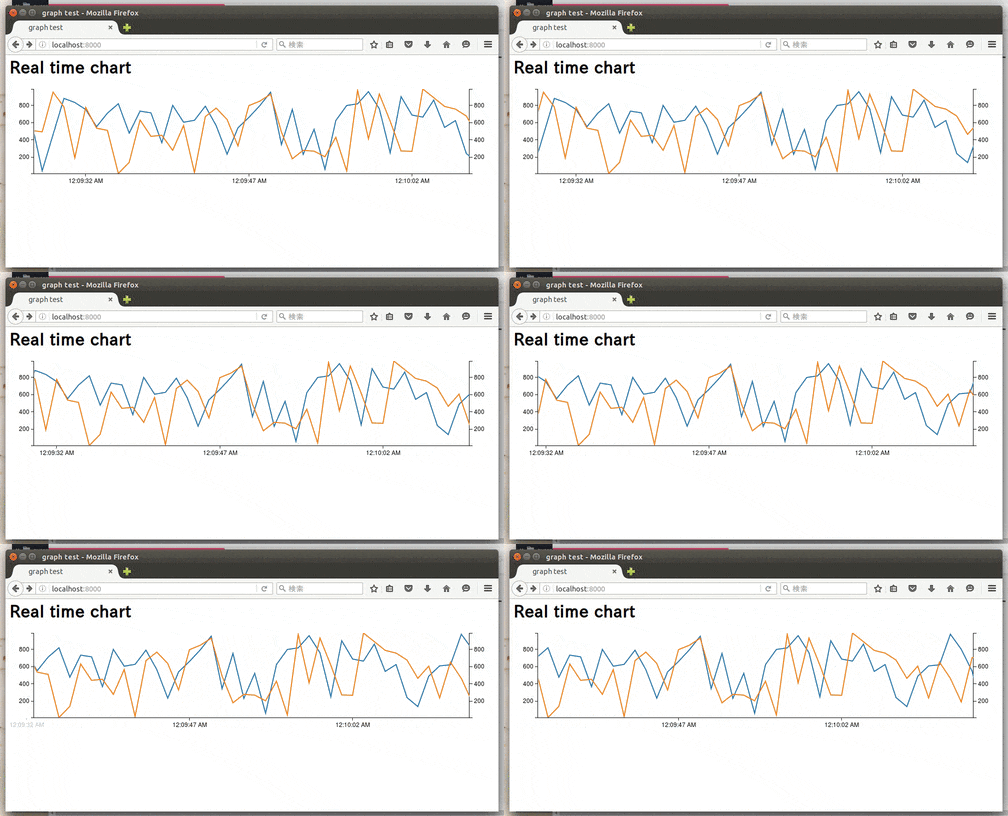
javascriptの勉強をかねて、webサーバから逐次データを流して、ブラウザ上でリアルタイムチャートを表示するアプリケーションをpythonの軽量WebフレームワークであるFlaskで作りました。為替とかをリアルタイムで描画するときに使えるかと思います。
サーバからのデータ送信はwebsocketを用いて行い、サーバ側でランダムに作成したデータを時刻と一緒にJSON形式で送っています。
クライアント側はjavascriptでwebsocketのデータを受けてグラフ描画を行います。
フォルダ構成
app.py
templates/index.html
static/js/d3.min.js
static/js/epoch.min.js
static/css/epoch.min.css
リアルタイムチャート作成にはd3.jsをベースにしたリアルタイムチャートライブラリであるEpochを使いました。ちなみにd3のバージョンはv3です。
websocketを使うにあたってはgevent-websocketを使っています。
app.py
import os
import json
import datetime
import random
import time
from gevent import pywsgi
from geventwebsocket.handler import WebSocketHandler
from flask import Flask, request, render_template

app = Flask(__name__)

@app.route('/')
def index():
    return render_template('index.html')

@app.route('/publish')
def publish():
    if request.environ.get('wsgi.websocket'):
        ws = request.environ['wsgi.websocket']
        while True:
            t = int(time.mktime(datetime.datetime.now().timetuple()))
            ws.send(json.dumps([{"time": t, "y": random.random() * 1000},
                                {"time": t, "y": random.random() * 1000}]))
            time.sleep(1)
    return

if __name__ == '__main__':
    app.debug = True
    server = pywsgi.WSGIServer(('localhost', 8000), app, handler_class=WebSocketHandler)
    server.serve_forever()
index.html
<html>
<head>
  <title>graph test</title>
</head>
<body>
  <h1>Real time chart</h1>
  <div id="graph" class="epoch" style="height: 200px;"></div>
  <script type="text/javascript" src="http://ajax.googleapis.com/ajax/libs/jquery/1.4.2/jquery.min.js"></script>
  <script type="text/javascript" src="{{ url_for('static', filename='js/d3.min.js') }}"></script>
  <script type="text/javascript" src="{{ url_for('static', filename='js/epoch.min.js') }}"></script>
  <link rel="stylesheet" type="text/css" href="{{ url_for('static', filename='css/epoch.min.css') }}">
  <script type="text/javascript">
  var ws = new WebSocket("ws://localhost:8000/publish");
  var data = [
      { label: "Series 1", values: [] },
      { label: "Series 2", values: [] },
    ];
  var lineChart = $('#graph').epoch({
    type: 'time.line',
    data: data,
    axes: ['left', 'right', 'bottom']
  });
  ws.onmessage = function(msg) {
    var current = JSON.parse(msg.data);
    lineChart.push(current);
  };
  </script>
</body>
</html>
以下を実行してlocalhost:8000にブラウザで接続してみてください。
python app.py
