共分散構造分析などでパス図を描くツールを探してみると以下2種類の方法が定番のようなので試してみました。お手軽なのはsemPlotですがgraphvizは自由度が高いです。
semPlot
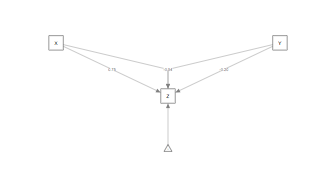
library(semPlot)
X <- rnorm(100)
Y <- rnorm(100)
Z <- rnorm(1) * X + rnorm(1) * Y + rnorm(1) * X * Y
DF <- data.frame(X, Y, Z)

# 回帰分析
res <- lm(Z ~ X * Y, data = DF)

# パスの描画
semPaths(res, whatLabels  = "stand", style = "lisrel")
下記のような要素間の関係を示すパス図が表示されます。
graphviz
1) brewでインストールします。
$ brew install graphviz
もしも下記のエラーになってしまった場合
==> Installing dependencies for graphviz: libpng
Error: Cannot link libpng
Another version is already linked: /usr/local/Cellar/libpng/1.6.25
$ sudo chown -R $(whoami):admin /usr/local
みたいにパーミッションを変更すれば回避できます
2) dotコマンドが以下のように存在していることを確認
$ dot -?
Usage: dot [-Vv?] [-(GNE)name=val] [-(KTlso)<val>] <dot files>
(additional options for neato)    [-x] [-n<v>]
:
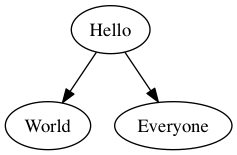
3) test.dotというファイル名でパスの構成を示すdotファイルを作成します
test.dot
digraph d {
 A [label="Hello"]
 B [label="World"]
 C [label="Everyone"]
 A -> { B C }
}
4) dotコマンドでパス図を作ります。うまくいくとコマンド実行時のディレクトリに test.png というファイルが生成されます。
$ dot -T png -O test.dot