概要
Raspberry PiとWindows 10 IoT Coreを使って、UWPアプリ上でグラフを表示する方法を紹介します。
ここでは、「LiveCharts」を使用しました。
結果
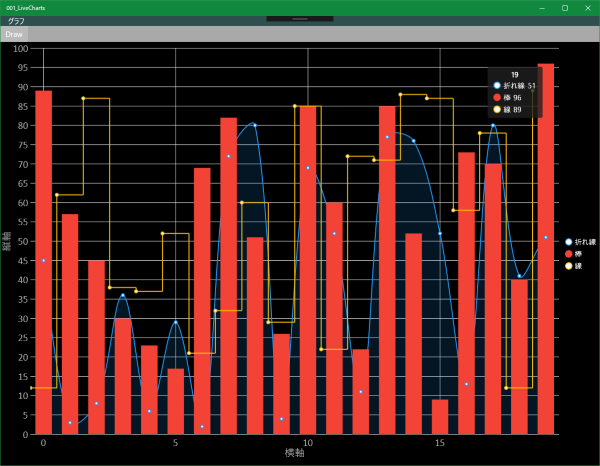
このような感じで表示できます。
例
- 折れ線グラフ、棒グラフ、線グラフを描画
- 凡例を右側に表示
- 縦軸、横軸の表示とフォントの変更
サンプルコード
準備
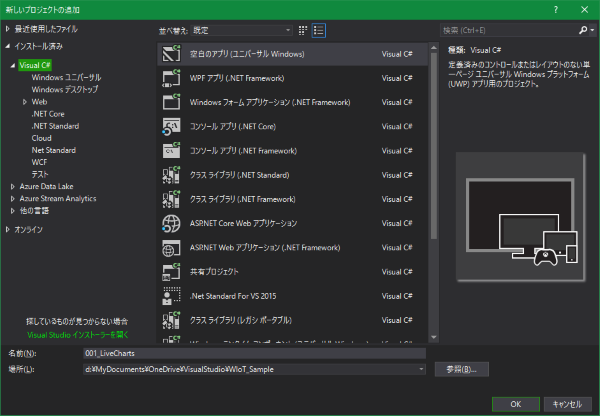
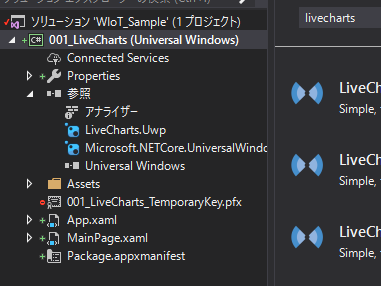
UWPアプリのプロジェクトを作成
1.「空白のアプリ(ユニバーサルWindows)」を選択
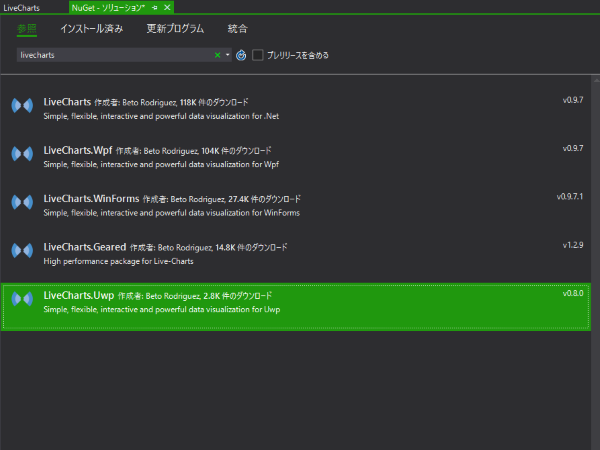
LiveChartsパッケージをインストール
「LiveCharts」で検索して、「LiveCharts.UWP」を選択
UWPアプリのプロジェクトを選んで、「インストール」ボタンを押す
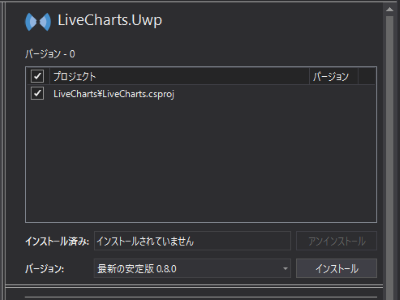
インストールが完了
コントロールを配置するまで
- usingを追加
MainPage.xaml.cs
using LiveCharts;
using LiveCharts.Uwp;
- SeriesCollection プロパティを追加
MainPage.xaml.cs
namespace _001_LiveCharts
{
    /// <summary>
    /// それ自体で使用できる空白ページまたはフレーム内に移動できる空白ページ。
    /// </summary>
    public sealed partial class MainPage : Page
    {
        public SeriesCollection Sc{ get; set; } = new SeriesCollection();

        public MainPage()
        {
            this.InitializeComponent();
        }
    }
}
- MainPage.xaml の冒頭に、
xmlns:lvc="using:LiveCharts.Uwpを追記(下記コードの8行目)
MainPage.xaml
<Page
    x:Class="_001_LiveCharts.MainPage"
    xmlns="http://schemas.microsoft.com/winfx/2006/xaml/presentation"
    xmlns:x="http://schemas.microsoft.com/winfx/2006/xaml"
    xmlns:local="using:_001_LiveCharts"
    xmlns:d="http://schemas.microsoft.com/expression/blend/2008"
    xmlns:mc="http://schemas.openxmlformats.org/markup-compatibility/2006"
    xmlns:lvc="using:LiveCharts.Uwp"
    mc:Ignorable="d"
    Background="{ThemeResource ApplicationPageBackgroundThemeBrush}">

    <Grid>
(以降、省略)
- グラフの見出しとなるStackPanelと、LiveChartコントロールを配置する
MainPage.xaml
(冒頭、省略)
    <Grid>
        <!--ページを2分割にする-->
        <Grid.RowDefinitions>
            <RowDefinition Height="Auto"/>
            <RowDefinition Height="*"/>
        </Grid.RowDefinitions>

        <StackPanel Grid.Row="0" >
            <Grid Background="DarkSlateGray">
                <!--見出しを配置-->
                <TextBlock Text=" グラフ" Foreground="White"/>
            </Grid>
            <Grid Background="DarkGray" >
                <!--ボタンを配置-->
                <Button Name="Btn_Draw" Content="Draw" Click="Btn_Draw_Click"/>
            </Grid>
        </StackPanel>

        <!--LiveChartを配置-->
        <Grid Grid.Row="1" HorizontalAlignment="Stretch" VerticalAlignment="Stretch">
            <lvc:CartesianChart x:Name="LC_Graph" Series="{x:Bind Path=Sc}" />
        </Grid>

    </Grid>
</Page>
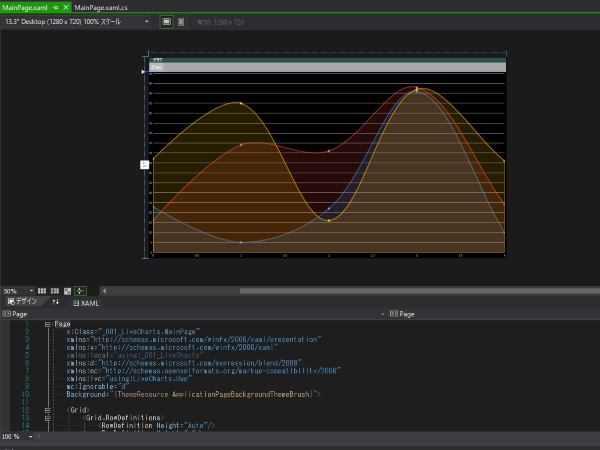
- この時点でデザイナーを見ると、このようになっています。
値を代入してグラフを描く
UWPで選択できるグラフはこちらを参考にしてください。
ひとまず、ランダムな値を代入して、グラフを書くところまでのコードです。
- コンストラクタ
MainPage.cs
        /// <summary>
        /// コンストラクタ
        /// </summary>
        public MainPage()
        {
            this.InitializeComponent();

            DataContext = this;
        }
- ボタンイベント
MainPage.cs
        /// <summary>
        /// ボタンをクリック
        /// </summary>
        /// <param name="sender"></param>
        /// <param name="e"></param>
        private void Btn_Draw_Click(object sender, RoutedEventArgs e)
        {
            /////////////////////////////////////
            //ステップ1:系列にグラフを追加
            /////////////////////////////////////
            Sc.Clear();
            Sc.Add(
                new LineSeries                     //折れ線グラフ
                {
                    //凡例名
                    Title = "折れ線",
                    //系列値
                    Values = new ChartValues<long>(),
                    //線の色(省略:自動で配色されます)
                    //Stroke = new Windows.UI.Xaml.Media.SolidColorBrush(Windows.UI.Colors.Red),
                    //直線のスムージング(0:なし、省略:あり)
                    //LineSmoothness = 0,

                });

            Sc.Add(
                new ColumnSeries                    //棒グラフ
                {
                    Title = "棒",
                    Values = new ChartValues<long>(),
                    //Stroke = new Windows.UI.Xaml.Media.SolidColorBrush(Windows.UI.Colors.Red),
                });

            Sc.Add(
                new StepLineSeries                  //線グラフ
                {
                    Title = "線",
                    Values = new ChartValues<long>(),
                    //Stroke = new Windows.UI.Xaml.Media.SolidColorBrush(Windows.UI.Colors.Red),
                });


            /////////////////////////////////////
            //ステップ2:LiveChartの設定
            /////////////////////////////////////
            //凡例の表示位置
            LC_Graph.LegendLocation = LegendLocation.Right;

            //軸の設定
            LC_Graph.AxisX.Clear();     //デフォルトで設定されている軸をクリア
            LC_Graph.AxisX.Add(new Axis { Title = "横軸", FontSize = 20 });
            LC_Graph.AxisY.Clear();
            LC_Graph.AxisY.Add(new Axis { Title = "縦軸", FontSize = 20, MinValue = 0 });


            /////////////////////////////////////
            //ステップ3:値をランダムに追加
            /////////////////////////////////////

            Random rnd = new Random();

            //各系列に、それぞれ値を代入
            for (int iSeries = 0; iSeries < Sc.Count; iSeries++)
            {
                Sc[iSeries].Values.Clear();

                //20点だけ追加
                for (int points = 0; points < 20; ++points)
                {
                    //乱数で数値を代入
                    Sc[iSeries].Values.Add((long)rnd.Next(100));
                }
            }
        }
補足
ハマったところの覚え書き
サンプルコードでエラー
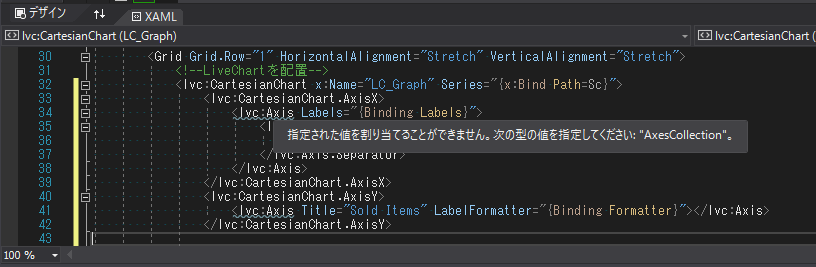
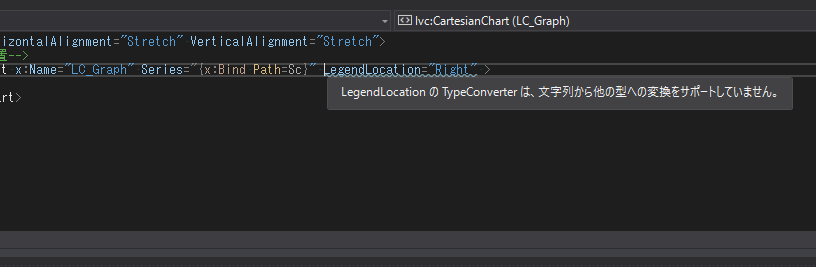
チュートリアルのXAMLの書き方に倣ってコードを書いてると、エラーが発生。
※いずれも、MainPage.csに直接、軸や凡例の指定を書いて、エラーを回避しました。
軸の指定
凡例の指定
必ずクリア
デフォルトで色々設定値が入ってるようなので、しっかりClearしましょう。
(例)
LC_Graph.AxisX.Clear(); //デフォルトで設定されている軸をクリア