目的
いろんな関数をリアルタイムプロットする
使ったもの
・epoch (javascriptライブラリ: https://epochjs.github.io/epoch/)
この公式サイトからzipファイルをダウンロードして、その中に含まれるtests/real-timeというフォルダに存在するline.htmlをベースに作成しました
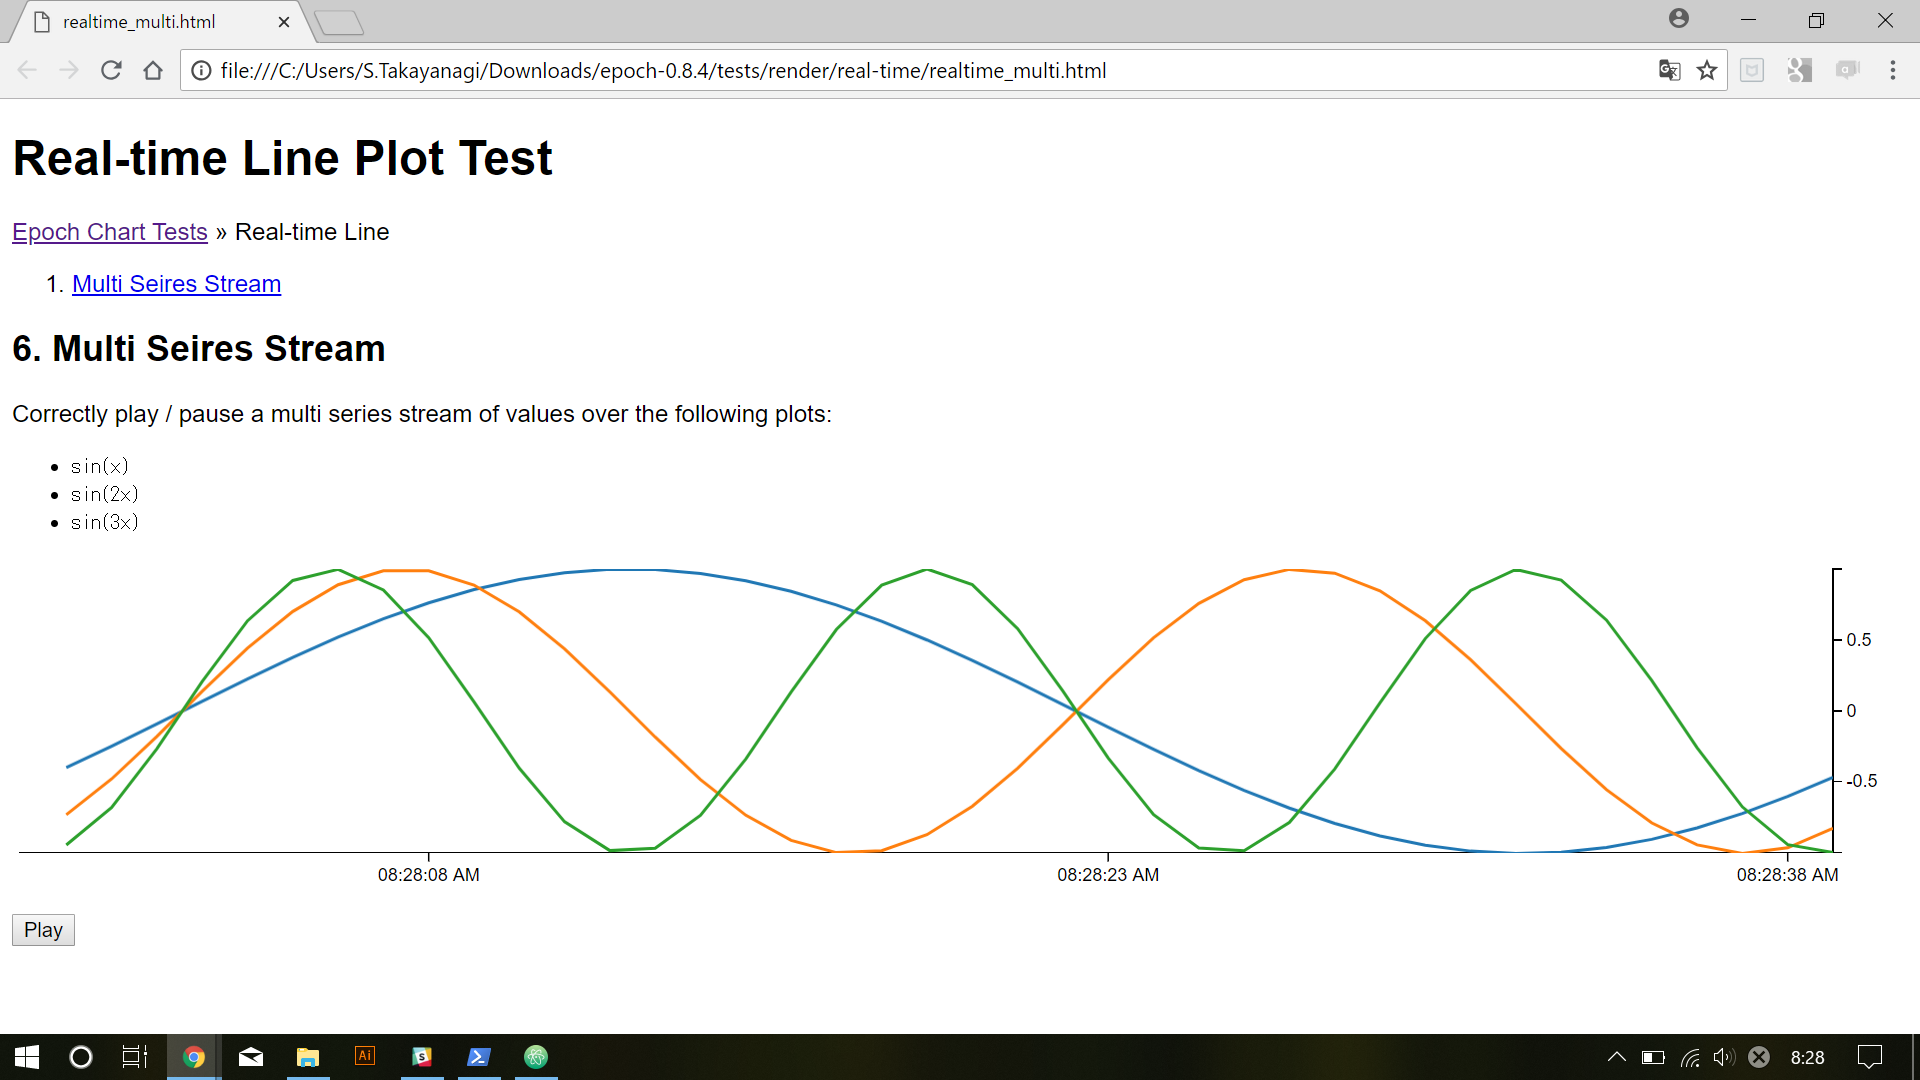
結果
時間を変数として動きます
今回使用したコード
realtime_plot.html
<!DOCTYPE html>
<html>
<head>
<meta charset="utf-8" />
<link rel="stylesheet" type="text/css" href="../css/tests.css">
<script src="http://code.jquery.com/jquery-1.10.1.min.js"></script>
<script src="http://d3js.org/d3.v3.js" charset="utf-8"></script>
<script src="../../../dist/js/epoch.js"></script>
<link rel="stylesheet" type="text/css" href="../../../dist/css/epoch.css">
<script>
var nextTime = (function() {
var currentTime = parseInt(new Date().getTime() / 1000);
return function() { return currentTime++; }
})();
</script>
</head>
<body>
<h1>Real-time Line Plot Test</h1>
<p class="breadcrumbs"><a href="../index.html">Epoch Chart Tests</a> » Real-time Line</p>
<ol>
<li><a href="#test-6">Multi Seires Stream</a></li>
</ol>
<!-- Test 6 ------------------------------------------------------------------------->
<div id="test-6" class="test">
<h2>6. Multi Seires Stream</h2>
<p>
Correctly play / pause a multi series stream of values over the following plots:
<ul>
<li><code>sin(x)</code></li>
<li><code>sin(2x)</code></li>
<li><code>sin(3x)</code></li>
</ul>
</p>
<div class="epoch"></div>
<p><button>Play</button></p>
</div>
<script>
// ネットで見つけた正規分布に従う乱数を発生させる関数
/**
* 正規分布乱数関数 参考:http://d.hatena.ne.jp/iroiro123/20111210/1323515616
* @param number m 平均μ
* @param number s 分散σ^2
* @return number ランダムに生成された値
*/
function seiki(m, s) {
var a = 1 - Math.random();
var b = 1 - Math.random();
var c = Math.sqrt(-2 * Math.log(a));
if(0.5 - Math.random() > 0) {
return c * Math.sin(Math.PI * 2 * b) * s + m;
}else{
return c * Math.cos(Math.PI * 2 * b) * s + m;
}
}
//-------グラフ描写--------------------------------------------
$(function draw_plot(){
var data = [
{label: 'A', values: []},
{label: 'B', values: []},
{label: 'C', values: []}
],
length = 40,
nextIndex = length,
scale = 0.1,
playing = false,
interval = null;
for (var i = 0; i < length; i++) {
var x = (i+1) * scale,
time = nextTime();
data[0].values.push({time: time, y:Math.sin(1*time/(2*Math.PI))});
data[1].values.push({time: time, y:Math.sin(2*time/(2*Math.PI))});
data[2].values.push({time: time, y:Math.sin(3*time/(2*Math.PI))});
}
var chart = $('#test-6 .epoch').epoch({
type: 'time.line',
data: data,
axes: ['right', 'bottom']
});
var pushPoint = function() {
var x = (nextIndex +1) * scale,
time = nextTime();
chart.push([
{ time: time, y:Math.sin(1*time/(2*Math.PI))},
{ time: time, y:Math.sin(2*time/(2*Math.PI))},
{ time: time, y:Math.sin(3*time/(2*Math.PI))}
]);
nextIndex++;
};
$('#test-6 button').on('click', function(e) {
if (playing) {
$(e.target).text('Play');
clearInterval(interval);
}
else {
$(e.target).text('Pause');
interval = setInterval(pushPoint, 1000);
pushPoint();
}
playing = !playing;
});
})
</script>
</body>
</html>
次回
ロジスティック方程式あたりを書かせてみます
微分方程式を自由に扱えるようになると楽しそうです
参考
D3.jsベースのEpochを使ってリアルタイムチャートを描いてみる
http://4009.jp/post/2015-11-19-realtimechart/