LoginSignup
111
107

More than 5 years have passed since last update.

chart.js 棒グラフ オプション色々

Last updated at Posted at 2017-10-16

chart.jsのオプションを色々使って棒グラフを描いてみる。

サンプルコード

<canvas id="canvas"></canvas>

    <script>
    var ctx = document.getElementById("canvas").getContext("2d");
    var myBar = new Chart(ctx, {
        type: 'bar',                           //◆棒グラフ
        data: {                                //◆データ
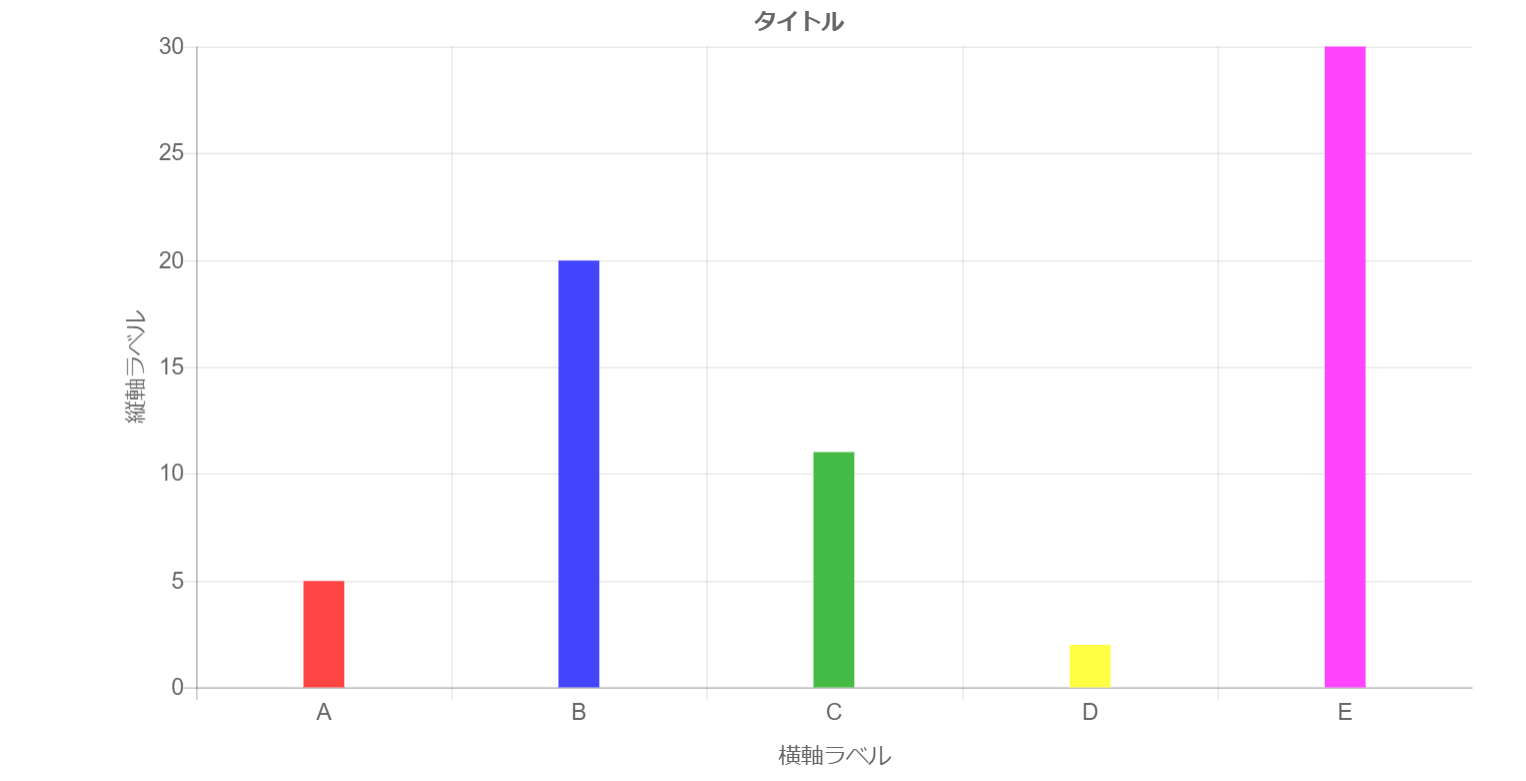
            labels: ['A','B','C','D','E'],     //ラベル名
            datasets: [{                       //データ設定
                data: [5,20,11,2,30],          //データ内容
                backgroundColor: ['#FF4444', '#4444FF', '#44BB44', '#FFFF44', '#FF44FF']   //背景色
            }]
        },
        options: {                             //◆オプション
            responsive: true,                  //グラフ自動設定
            legend: {                          //凡例設定
                display: false                 //表示設定
           },
            title: {                           //タイトル設定
                display: true,                 //表示設定
                fontSize: 18,                  //フォントサイズ
                text: 'タイトル'                //ラベル
            },
            scales: {                          //軸設定
                yAxes: [{                      //y軸設定
                    display: true,             //表示設定
                    scaleLabel: {              //軸ラベル設定
                       display: true,          //表示設定
                       labelString: '縦軸ラベル',  //ラベル
                       fontSize: 18               //フォントサイズ
                    },
                    ticks: {                      //最大値最小値設定
                        min: 0,                   //最小値
                        max: 30,                  //最大値
                        fontSize: 18,             //フォントサイズ
                        stepSize: 5               //軸間隔
                    },
                }],
                xAxes: [{                         //x軸設定
                    display: true,                //表示設定
                    barPercentage: 0.4,           //棒グラフ幅
                    categoryPercentage: 0.4,      //棒グラフ幅
                    scaleLabel: {                 //軸ラベル設定
                       display: true,             //表示設定
                       labelString: '横軸ラベル',  //ラベル
                       fontSize: 18               //フォントサイズ
                    },
                    ticks: {
                        fontSize: 18             //フォントサイズ
                    },
                }],
            },
            layout: {                             //レイアウト
                padding: {                          //余白設定
                    left: 100,
                    right: 50,
                    top: 0,
                    bottom: 0
                }
            }
        }
    });
    </script>

グラフ

sample.png

111
107
0

Register as a new user and use Qiita more conveniently

  1. You get articles that match your needs
  2. You can efficiently read back useful information
  3. You can use dark theme
What you can do with signing up
111
107