マイクロベンチマーク
JavaのベンチマークアプリといえばJMeterが有名ですが、その計測対象はシステム全体の性能を計測するような大きなものです。
より小さな単位であるクラスやメソッド単位の性能計測をマイクロベンチマークと言うそうです。
Caliper
従来手法であればマイクロベンチマークはSystem.currentTimeMillis()やSystem.nanoTime()で計測しますが、これをより使いやすく体系化させたツールがCaliperとなります。
ツールというよりどちらかといえばJUnitのようなテストフレームワークと呼ぶほうが正しいかもしれません。
JavaマイクロベンチマークといえばJMHの方がスタンダードですが、あまり利用されてなさそうなCaliperを使ってみたいと思います。
Caliperの情報ですが、GoogleCodeからGithubに移管された関係上なのか、ほとんど公式のドキュメントが参照できなくなっており、今後の将来性が不明瞭なためまだまだ業務利用には適さないと思います。
画像検索をおこなうとCaliperを動かせば下記のような画像が出力できるようです。
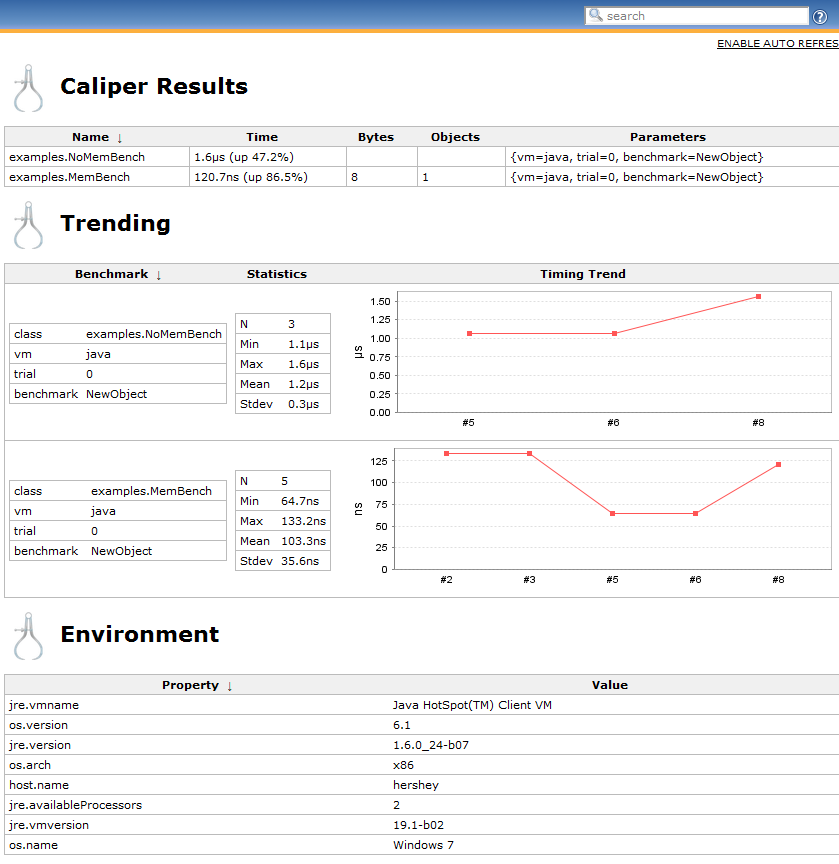
caliper
https://github.com/google/caliper
公式にもREADMEにもほとんど情報がなく、tutorialやexamplesを見るしか無い…(涙
Caliper利用方法
前述のとおり情報が殆ど無いです。
Mavenのセントラルリポジトリに最新バージョン1.0-beta-2が2015/03/06に出ていたのでこちらを利用します。
<dependency>
    <groupId>com.google.caliper</groupId>
    <artifactId>caliper</artifactId>
    <version>1.0-beta-2</version>
</dependency>
チュートリアルにcaliper/tutorial/Tutorial.javaがあったのでこれを動かしてみます。
ソースはこちらを参照ください。
https://github.com/google/caliper/blob/master/scripts/caliper
動かし方はREADMEのどこにも記載していないのですがcaliper/scripts/caliperを見るとそれっぽい動かしたかが書いてました。
しかしコメントに#roughって書いてます。ラフ。
#!/bin/sh

# rough

export PATH=$PATH:$JAVA_HOME/bin
base=`dirname $0`
export ALLOCATION_JAR=$base/lib/allocation.jar
exec java -cp $base/lib/caliper-@VERSION@.jar:$ALLOCATION_JAR:$CLASSPATH com.google.caliper.Runner $*
これを参考に動かしましたが、指定されているcom.google.caliper.RunnerというMainクラスが見当たらなかったです、残念。
直接ソースからMainクラスを探すとcom.google.caliper.runner.CaliperMainというクラスを見つけたのでこれを代わりに使います。
コマンド経由から起動させます。
依存ライブラリを集めるため、以下のMavenコマンドでJARを出力しておきます。
# JARをtarget/dependencyフォルダに出力します。
> mvn dependency:copy-dependencies
APIキー設定
コンフィグ設定を行います
Caliperのテスト結果はGoogle App EngineにUploadされるようです(!!)
こちらのページからログインして、APIキーを取得します。
右上のキーがAPIキーのようです。値は黒塗りしています。
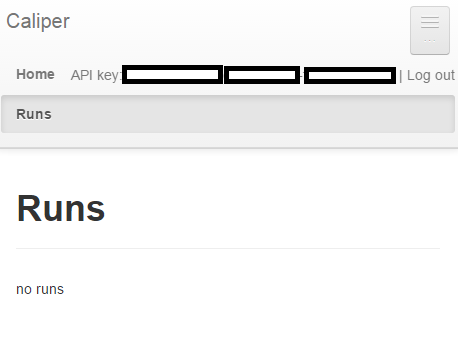
コンフィグファイルにAPIキーを追記します。
Linuxでは~/.caliper/config.propertiesです。
本当はAPIキーだけでよさそうですが、caliperを空実行した際に以下の形式でファイルが出力されていたのでそれをテンプレートにします。
# Caliper config file
# Run with --print-config to see all of the options being applied

# INSTRUMENT CONFIG
# instrument.micro.options.warmup=10s
# instrument.micro.options.timingInterval=500ms
# instrument.micro.options.reportedIntervals=7
# instrument.micro.options.maxRuntime=10s

# VM CONFIG
vm.args=-Xmx3g -Xms3g

# See the Caliper webapp to get a key so you can associate results with your account
results.upload.options.key=00000000-0000-0000-0000-000000000000
実行
実行シェルを作成します。
最近の-cpはクラスパスのワイルドカード指定できるそうですが、OpernJDK8では使えなかったので従来通りfor文でパスを通しています。
#!/bin/sh

# カレントディレクトリに移動
cd "$(dirname "$0")"

# JARのパスを通す
CLASSPATH="target/classes"
for file in target/dependency/*.jar;
    do CLASSPATH=${CLASSPATH}:${file};
done

# 実行
java -cp ${CLASSPATH} \
-DproxySet=true \
-Dhttp.proxyHost=my.proxy.com \
-Dhttp.proxyPort=8080 \
-Dhttps.proxyHost=my.proxy.com \
-Dhttps.proxyPort=8080 \
com.google.caliper.runner.CaliperMain $@

exit $?
実行引数で-Dsize=10,100,1000を与えてみたいなことをTutorial.javaのJavaDocに書いてたので与えます。
引数に-Dsizeという値を与えてますが、これはベンチマーククラスに@paramで与えられてるパラメータです。
テスト内容は配列のiteration速度を計測するものです。
ソースは下記を参考してください。
Tutorial$Benchmark5
https://github.com/google/caliper/blob/master/tutorial/Tutorial.java
# 実行
$ sh caliper.sh Tutorial.Benchmark5 -Dsize=10,100,1000

# 実行ログ
Experiment selection:
  Benchmark Methods:   [timeArrayIteration]
  Instruments:   [allocation, runtime]
  User parameters:   {size=[10, 100, 1000]}
  Virtual machines:  [default]
  Selection type:    Full cartesian product

This selection yields 6 experiments.

## 以下省略 ##
以下のログが出る場合はヒープサイズ不足の可能性があります。
今回はconfigファイルで指定していますが、デフォルトでも3GB程度必要みたいです。
ERROR: Trial failed to complete (its results will not be included in the run):
  The worker exited without producing data. It has likely crashed. Inspect
C:\Users\XXX\AppData\Local\Temp\1435384401215-0\trial-1.log to see any worker output.

[stdout] Error occurred during initialization of VM
[stdout] Could not reserve enough space for 3145728KB object heap
結果
上記で1分ほど待つと結果が出ました。
allocationとruntimeの2種類のVMで実行してくれるようです。
This selection yields 6 experiments.
Trial Report (1 of 6):
  Experiment {instrument=allocation, benchmarkMethod=timeArrayIteration, vm=default, parameters={size=100}}
  Results:
    bytes(B): min=0.00, 1st qu.=0.00, median=0.00, mean=0.00, 3rd qu.=0.00, max=0.00
    objects: min=0.00, 1st qu.=0.00, median=0.00, mean=0.00, 3rd qu.=0.00, max=0.00
Trial Report (2 of 6):
  Experiment {instrument=allocation, benchmarkMethod=timeArrayIteration, vm=default, parameters={size=10}}
  Results:
    bytes(B): min=0.00, 1st qu.=0.00, median=0.00, mean=0.00, 3rd qu.=0.00, max=0.00
    objects: min=0.00, 1st qu.=0.00, median=0.00, mean=0.00, 3rd qu.=0.00, max=0.00
Trial Report (3 of 6):
  Experiment {instrument=allocation, benchmarkMethod=timeArrayIteration, vm=default, parameters={size=1000}}
  Results:
    bytes(B): min=0.00, 1st qu.=0.00, median=0.00, mean=0.00, 3rd qu.=0.00, max=0.00
    objects: min=0.00, 1st qu.=0.00, median=0.00, mean=0.00, 3rd qu.=0.00, max=0.00
Trial Report (4 of 6):
  Experiment {instrument=runtime, benchmarkMethod=timeArrayIteration, vm=default, parameters={size=10}}
  Results:
    runtime(ns): min=2.85, 1st qu.=2.86, median=2.87, mean=3.08, 3rd qu.=2.90, max=4.75
Trial Report (5 of 6):
  Experiment {instrument=runtime, benchmarkMethod=timeArrayIteration, vm=default, parameters={size=100}}
  Results:
    runtime(ns): min=25.75, 1st qu.=25.80, median=25.88, mean=25.95, 3rd qu.=26.10, max=26.38
Trial Report (6 of 6):
  Experiment {instrument=runtime, benchmarkMethod=timeArrayIteration, vm=default, parameters={size=1000}}
  Results:
    runtime(ns): min=437.04, 1st qu.=437.10, median=437.19, mean=437.17, 3rd qu.=437.22, max=437.32
Collected 81 measurements from:
  2 instrument(s)
  2 virtual machine(s)
  3 benchmark(s)

Execution complete: 1.061 min.
Results have been uploaded. View them at: https://microbenchmarks.appspot.com/runs/00000000-0000-0000-0000-000000000000 #※APIキーは変えてます
Caliper自体のアプリケーションログは~/.caliper/log/以下に出力されるようです。
実行結果は~/.caliper/result以下にJSON形式で出力されるようです。
最後のhttpsのサイトにアクセスすると実行結果がGoogleのサーバにUploadされてました。
これが許容できるかどうかがCaliperが導入できるかどうかの判断基準でしょうか。
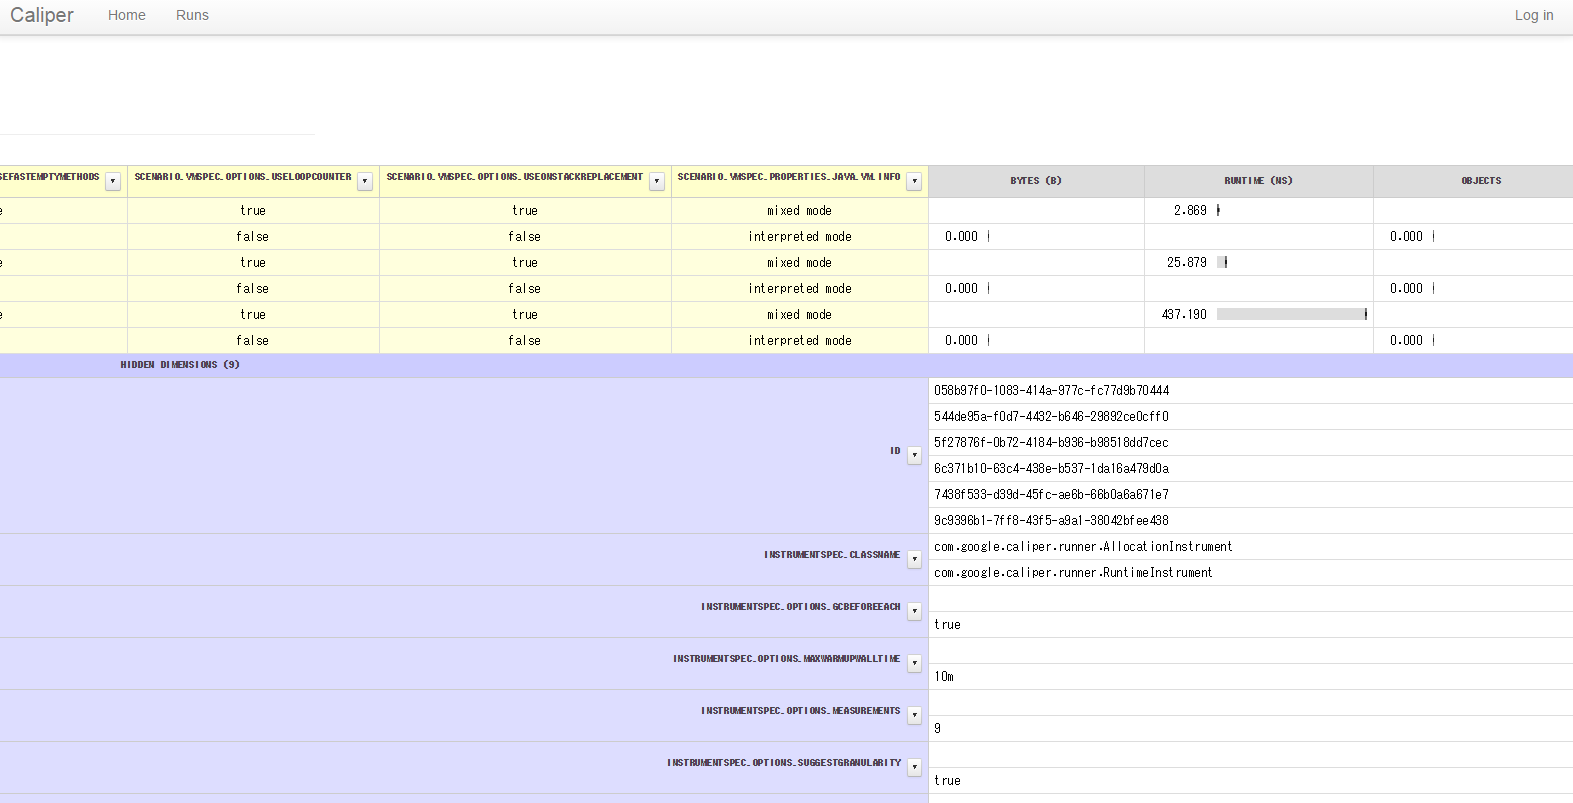
以下のような画面でした。
実行結果がグラフィカルに表示されています。
1000要素の配列のiteratinoに437.190[ms]かかっています。
むちゃくちゃ遅いですね。
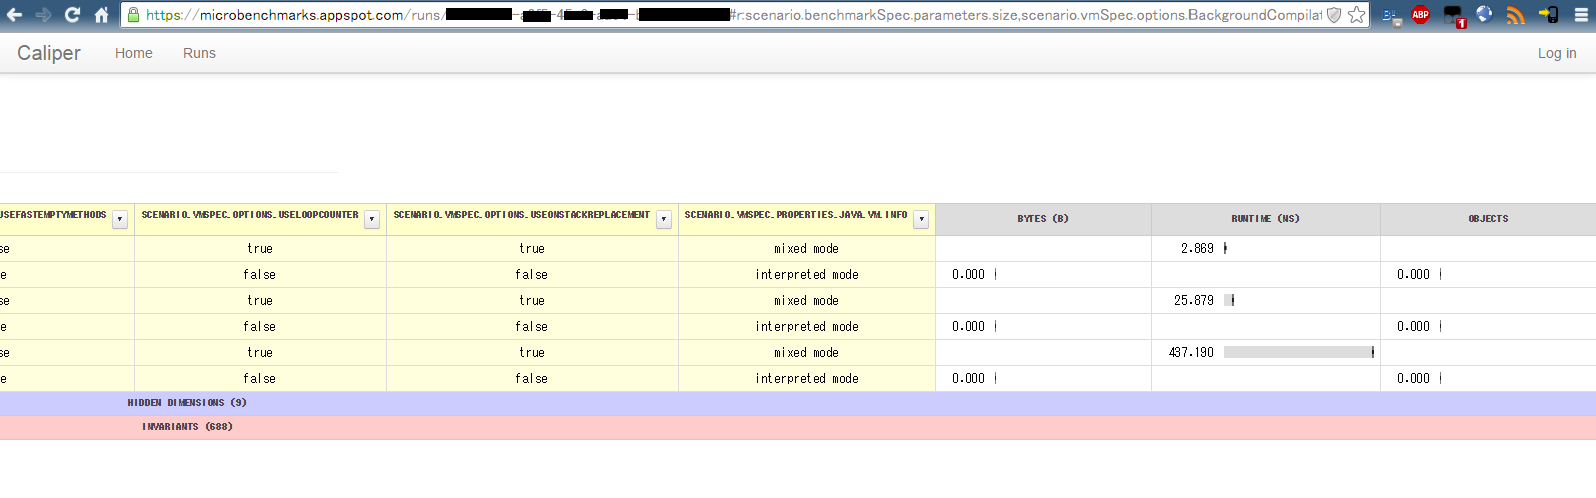
画面の青いところや赤いところをクリックすると各テストの詳細情報が参照できるようです。
実行結果が正しいものか検証を行いたいところですが、情報が少なすぎて進捗が思わしくないので打ち切ります。
正式のドキュメントが整備されたらもっと踏み込んで中身を見てみたいと思います。
実行オプション
実行オプションで-hを渡せばオプションがわかるようです。
プロパティがちゃんと読み込まれているかどうかは-pオプションで確認できます。
# helpの実行
$ sh caliper.sh -h

# オプション表示
Usage:
 java com.google.caliper.runner.CaliperMain <benchmark_class_name> [options...]

Options:
 -h, --help         print this message
 -n, --dry-run      instead of measuring, execute a single rep for each scenario
                    in-process
 -b, --benchmark    comma-separated list of benchmark methods to run; 'foo' is
                    an alias for 'timeFoo' (default: all found in class)
 -m, --vm           comma-separated list of VMs to test on; possible values are
                    configured in Caliper's configuration file (default:
                    whichever VM caliper itself is running in, only)
 -i, --instrument   comma-separated list of measuring instruments to use; possible
                    values are configured in Caliper's configuration file
                    (default: "allocation,runtime")
 -t, --trials       number of independent trials to peform per benchmark scenario;
                    a positive integer (default: 1)
 -l, --time-limit   maximum length of time allowed for a single trial; use 0 to allow
                    trials to run indefinitely. (default: 30s)
 -r, --run-name     a user-friendly string used to identify the run
 -p, --print-config print the effective configuration that will be used by Caliper
 -d, --delimiter    separator used in options that take multiple values (default: ',')
 -c, --config       location of Caliper's configuration file (default:
                    $HOME/.caliper/config.properties)
 --directory        location of Caliper's configuration and data directory
                    (default: $HOME/.caliper)

 -Dparam=val1,val2,...
     Specifies the values to inject into the 'param' field of the benchmark
     class; if multiple values or parameters are specified in this way, caliper
     will try all possible combinations.

 -CconfigProperty=value
     Specifies a value for any property that could otherwise be specified in
     $HOME/.caliper/config.properties. Properties specified on the command line
     will override those specified in the file.

See http://code.google.com/p/caliper/wiki/CommandLineOptions for more details.
まとめ
Caliperのアイデアは面白そうですが、実際の業務利用だとドキュメントがメンテナンスされていないのが厳しいので、素直にJMHが推奨だと思います。
さらに実行結果がGoogleAppEngineに自動でUploadされてグラフ化される仕様なので、コンプライアンス通すのが厳しいと思った方はJMH使ったほうが良いです。
また、実はAPIキーを登録して実行したものの、ログアウトしても実行結果サイトにアクセスできます。
APIキーを登録すると紐付いたテスト結果を一覧表示出来るようで、認証という意味ではないようです。
参考サイト
Caliperに関して目新しいのはないですね。
(けっこうなオワコン臭がしてます…)
Micro Benchmarking With Caliper
http://codingjunkie.net/micro-benchmarking-with-caliper/
Getting started with Google Caliper
http://vertexlabs.co.uk/blog/caliper