ありそうで無かったので記事にしてみた。
4次元の特徴量を持つデータが6つあったとする。
sample.csv
1,2,3,4
1,2,3,5
1,2,4,5
4,3,2,1
5,3,2,1
5,4,2,1
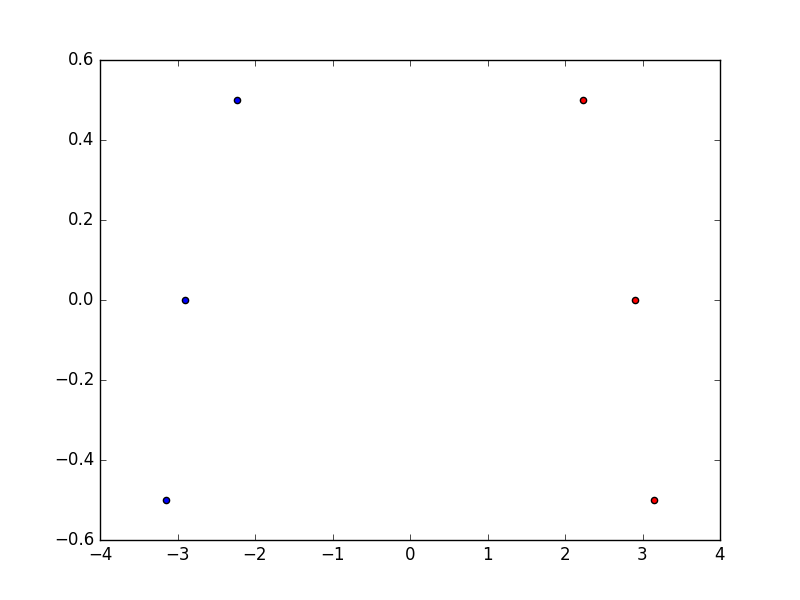
これをK-meansによりクラスタリングした上で、PCAで次元削減して散布図にプロットする。
K-meansのドキュメントはここ、PCAのドキュメントはここ、pyplotのドキュメントはここ。
sample.py
# -*- coding: UTF-8 -*-
import numpy as np
from sklearn.cluster import KMeans
from sklearn.decomposition import PCA
import matplotlib.pyplot as plt

# sample.csvを読み込む
users = np.loadtxt('./sample.csv', delimiter=",")

# K-meansによるクラスタリング
model = KMeans(n_clusters=2).fit(users)

# PCAで次元削減
pca = PCA(n_components=2)
users_r = pca.fit_transform(users)

# 結果を散布図にプロット
plt.figure()
for (i, label) in enumerate(model.labels_):
    if label == 0:
        plt.scatter(users_r[i, 0], users_r[i, 1], c='red')
    elif label == 1:
        plt.scatter(users_r[i, 0], users_r[i, 1], c='blue')
plt.show()
次のような散布図が得られる。