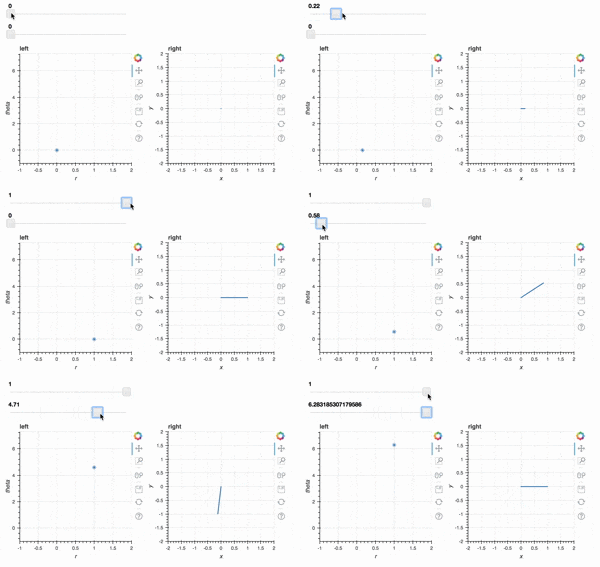
はじめに
試しにbokehを使ってみたのでそのメモです.
環境
- Python 3.6.0
- bokeh (0.12.4)
bokehによるプロットの流れ
(1). イベントハンドラー関数の定義
(2). データの準備
(3). figureの準備
(4). ウィジェットの準備
(5). レイアウトを決める
やってみた感じ,大まかにはこの5ステップを埋めて行く感じで書いていけばできそうです.
インストール
pipで入る.
pip install bokeh
(1).イベントハンドラー関数の定義
import numpy as np

from bokeh.io import curdoc
from bokeh.plotting import figure, ColumnDataSource
from bokeh.models.widgets import Slider
from bokeh.layouts import layout, row, widgetbox

def update_data(attr, old, new):
    r = np.array([r_widget.value])
    theta = np.array([theta_widget.value])
    x = np.c_[0, r*np.cos(theta)]
    y = np.c_[0, r*np.sin(theta)]
    source.data = dict(r=r, theta=theta)
    source2.data = dict(x=x, y=y)
このbokehのSlider Exampleを参考にしているが,グローバルにアクセスしまくっていて怖いのだがこういうものなのだろうか.
update_dataの引数は,ここに,「全てのwidgetはon_changeメソッドを持っていて,イベントハンドラー(ここではupdate_data関数)は引数が (attr, old, new)であることを想定している.」と書いてあるので,そういうものかと思っておく.
(2). データの準備
r = np.array([0.])
theta = np.array([0.])
x = np.c_[0, r*np.cos(theta)]
y = np.c_[0, r*np.sin(theta)]

source = ColumnDataSource(data=dict(r=r, theta=theta))
source2 = ColumnDataSource(data=dict(x=x, y=y))
ColumnDataSourceがリストライクなものしか受け付けてくれないので,rとthetaは上のようになっている.
正確にいうと,リストライクなものをvalueとしたdictか,pandas dataframe,Pandas GroupBy objectを受け付けてくれるようだ.
ちなみにここで定義しているr,theta,x,yは,スライドバーを動かす前に最初に表示するグラフになる.
(3). figureの準備
r_min, r_max = 0., 1.
theta_min, theta_max = 0., 2*np.pi

left = figure(width=320, height=320, title="left", x_range=(r_min - 1, r_max+1),\
                 y_range=(theta_min-1, theta_max+1) ,x_axis_label='r',  y_axis_label='theta')
left.asterisk('r', 'theta', size=10, angle=0.0, source=source)

right = figure(width=320, height=320, title="right", \
                x_range=(-r_max-1, r_max+1), y_range=(-r_max-1, r_max+1), \
                x_axis_label='x',  y_axis_label='y')
right.line('x', 'y', line_width=2, line_cap="round", line_join="miter", source=source2)
left.asterisk, right.lineなどの描画メソッドは,第1,2引数でデータを渡すのだが,ここでやっているように,sourceのkeyを渡して,source引数にさっき定義したやつを渡すこともできる.
figureにくっついている描画メソッドについてはここ.
(4). ウィジェットの準備
r_widget = Slider(value=0.0, start=0., end=1., step=0.01)
theta_widget = Slider(value=0.0, start=0., end=2*np.pi, step=0.01)

r_widget.on_change('value', update_data)
theta_widget.on_change('value', update_data)
on_changeは,第1引数にattrname, 第2引数にイベントハンドラーを渡す.attrnameにvalueを渡しているのは,ここではr_widgetの保持しているvalue変数がスライダーをいじって変わった際に,イベントハンドラーを呼ぶという意味.
最初の状態では,Slider(value=0.0)で指定した0になってる.
r_widget.value
# 0.0
(5). レイアウトを決める
wbox = widgetbox(children=[r_widget, theta_widget])
plots = row(left, right)
l = layout([[wbox],[plots]])

curdoc().add_root(l)
レイアウト関係のオブジェクトはここ.
layout()の引数は2次元リストで,そこに並べたようにプロットやウジェットを配置してくれる.
curdoc()とは,現在のドキュメントを返してくれて,そこに自分で定義したレイアウトを入れている.
ここでいうドキュメントとは,以下の図のようにbokehが定義しているオブジェクトで,最終的に出したいアウトプットのようなもの.(一瞬使い方メモという意味のドキュメントかと思ったが違うようだ.)
実行
実行はシェルで以下のようにすると,ブラウザで開いてくれる.
bokeh serve --show test.py
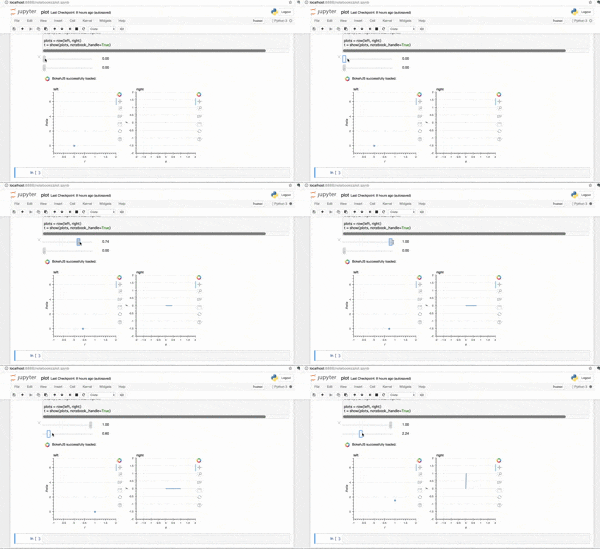
おまけ:jupyter notebookの場合
jupyter notebookでやる場合には,widgetをbokehのwidgetではなく,ipywidgetsのものを使わないといけないようだ.
これは,bokehがバックエンド側(pythonを実行するカーネル)とフロントエンド側(html, js)にまたがっていて,バックエンド側が上のやり方ではbokeh serverが担っていたのが,notebookだとipykernelが担うので,そのための調整ではないかと思われる.(多分)
そして上ではカレントドキュメントに出力していたのを,output_notebook, push_notebookを使って,ノートブックに出力すれば良い.
output_notebookは最初に宣言すれば良い.
また,イベントハンドラーの引数も変わっていることに注意.
import numpy as np
from bokeh.io import output_notebook, push_notebook
from bokeh.plotting import figure, ColumnDataSource, show

from bokeh.layouts import layout, row, widgetbox
from bokeh.models.widgets import Slider

import ipywidgets
from ipywidgets import interact
from IPython.display import display


# (1).イベントハンドラー関数の定義
def r_on_value_change(change):
    r = np.array([change["new"]])
    theta = np.array([theta_widgets.value])
    x = np.c_[0., r*np.cos(theta)]
    y = np.c_[0., r*np.sin(theta)]
    source.data = dict(r=r, theta=theta)
    source2.data = dict(x=x, y=y)
    push_notebook(handle=t)

def theta_on_value_change(change):
    r = np.array([r_widgets.value])
    theta = np.array([change["new"]])
    x = np.c_[0., r*np.cos(theta)]
    y = np.c_[0., r*np.sin(theta)]
    source.data = dict(r=r, theta=theta)
    source2.data = dict(x=x, y=y)
    push_notebook(handle=t)

output_notebook()

# (2). データの準備
r = np.array([0.])
theta = np.array([0.])
x = np.c_[0, r*np.cos(theta)]
y = np.c_[0, r*np.sin(theta)]

source = ColumnDataSource(data=dict(r=r, theta=theta))
source2 = ColumnDataSource(data=dict(x=x, y=y))

r_min, r_max = 0, 1
theta_min, theta_max = 0, 2*np.pi

# (3). figureの準備
left = figure(width=320, height=320, title="left", x_range=(r_min - 1, r_max+1), y_range=(theta_min-1, theta_max+1) ,x_axis_label='r',  y_axis_label='theta')
left.asterisk('r', 'theta', size=10, angle=0.0, source=source)

right = figure(width=320, height=320, title="right", x_range=(-r_max-1, r_max+1), y_range=(-r_max-1, r_max+1), x_axis_label='x',  y_axis_label='y')
right.line('x', 'y', line_width=2, line_cap="round", line_join="miter", source=source2)

# (4). ウィジェットの準備
r_widgets = ipywidgets.FloatSlider(\
    value=0, min=r_min, max=r_max, step=0.01)
r_widgets.observe(r_on_value_change, names="value")

theta_widgets = ipywidgets.FloatSlider(
    value=0, min=theta_min, max=theta_max, step=0.01)
theta_widgets.observe(theta_on_value_change, names="value")
display(r_widgets,theta_widgets)

# (5). レイアウトを決める
plots = row(left, right)
t = show(plots, notebook_handle=True)
終わりに
- なんかプロットが動くだけで感動するので使っていきたい.


